QUESTION IMAGE
Question
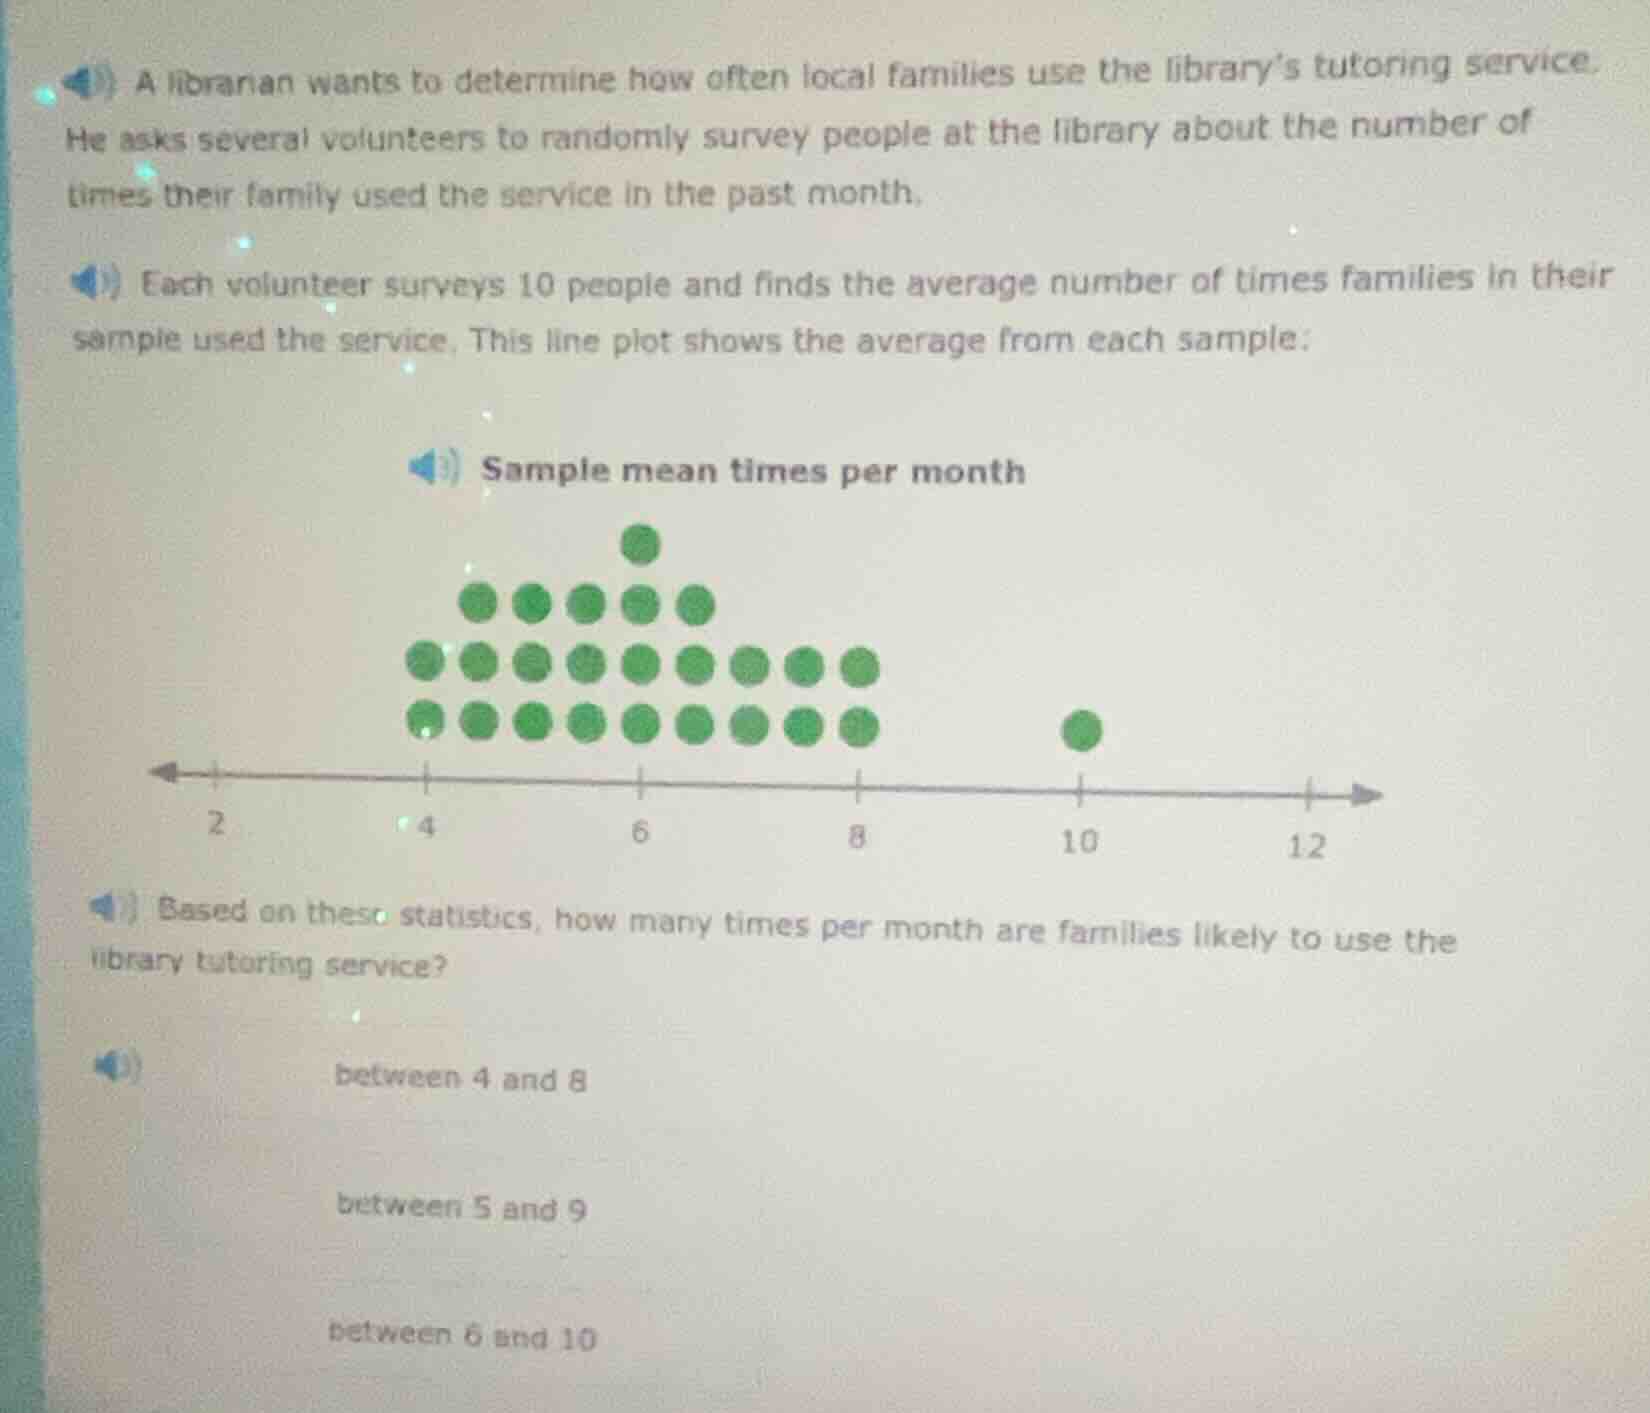
a librarian wants to determine how often local families use the library’s tutoring service. he asks several volunteers to randomly survey people at the library about the number of times their family used the service in the past month. each volunteer surveys 10 people and finds the average number of times families in their sample used the service. this line plot shows the average from each sample: sample mean times per month line plot image omitted based on these statistics, how many times per month are families likely to use the library tutoring service? between 4 and 8 between 5 and 9 between 6 and 10
To determine the likely range of times families use the tutoring service, we analyze the line plot of sample means. Most sample means (the dots) are concentrated between 4 and 8. The option "between 4 and 8" best captures the central cluster of the data, as the majority of sample averages fall within this interval, indicating the most probable range for family usage.

Snap & solve any problem in the app
Get step-by-step solutions on Sovi AI
Photo-based solutions with guided steps
Explore more problems and detailed explanations
between 4 and 8