QUESTION IMAGE
Question
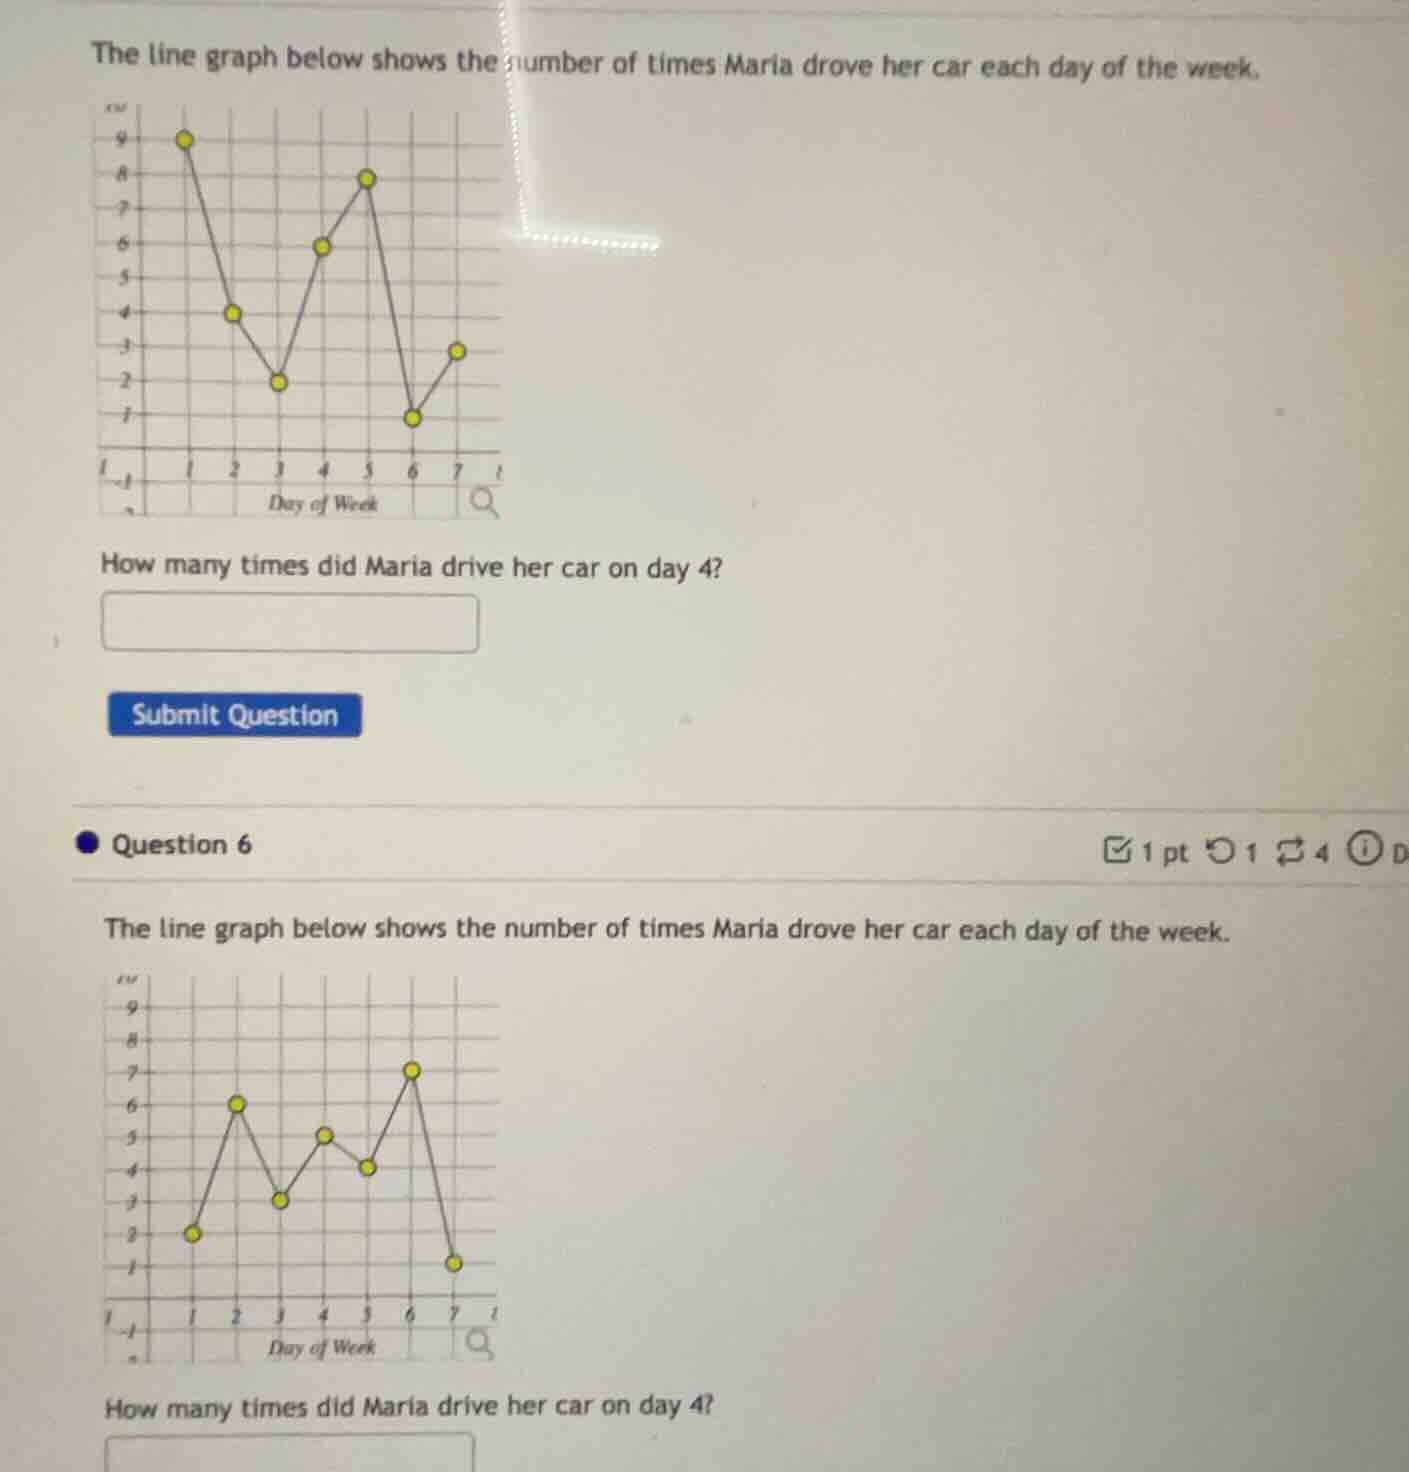
the line graph below shows the number of times maria drove her car each day of the week.
how many times did maria drive her car on day 4?
question 6
the line graph below shows the number of times maria drove her car each day of the week.
how many times did maria drive her car on day 4?
First Sub - Question (Top Line Graph)
Step1: Locate Day 4 on the x - axis
Find the position corresponding to "Day 4" on the horizontal axis of the top line graph.
Step2: Find the y - value at Day 4
Look at the point on the line graph that aligns with Day 4 on the x - axis. Then, check the vertical (y - axis) value. From the graph, the point for Day 4 has a y - value of 6.
Step1: Locate Day 4 on the x - axis
Find the position corresponding to "Day 4" on the horizontal axis of the bottom line graph.
Step2: Find the y - value at Day 4
Look at the point on the line graph that aligns with Day 4 on the x - axis. Then, check the vertical (y - axis) value. From the graph, the point for Day 4 has a y - value of 5.

Snap & solve any problem in the app
Get step-by-step solutions on Sovi AI
Photo-based solutions with guided steps
Explore more problems and detailed explanations
6