QUESTION IMAGE
Question
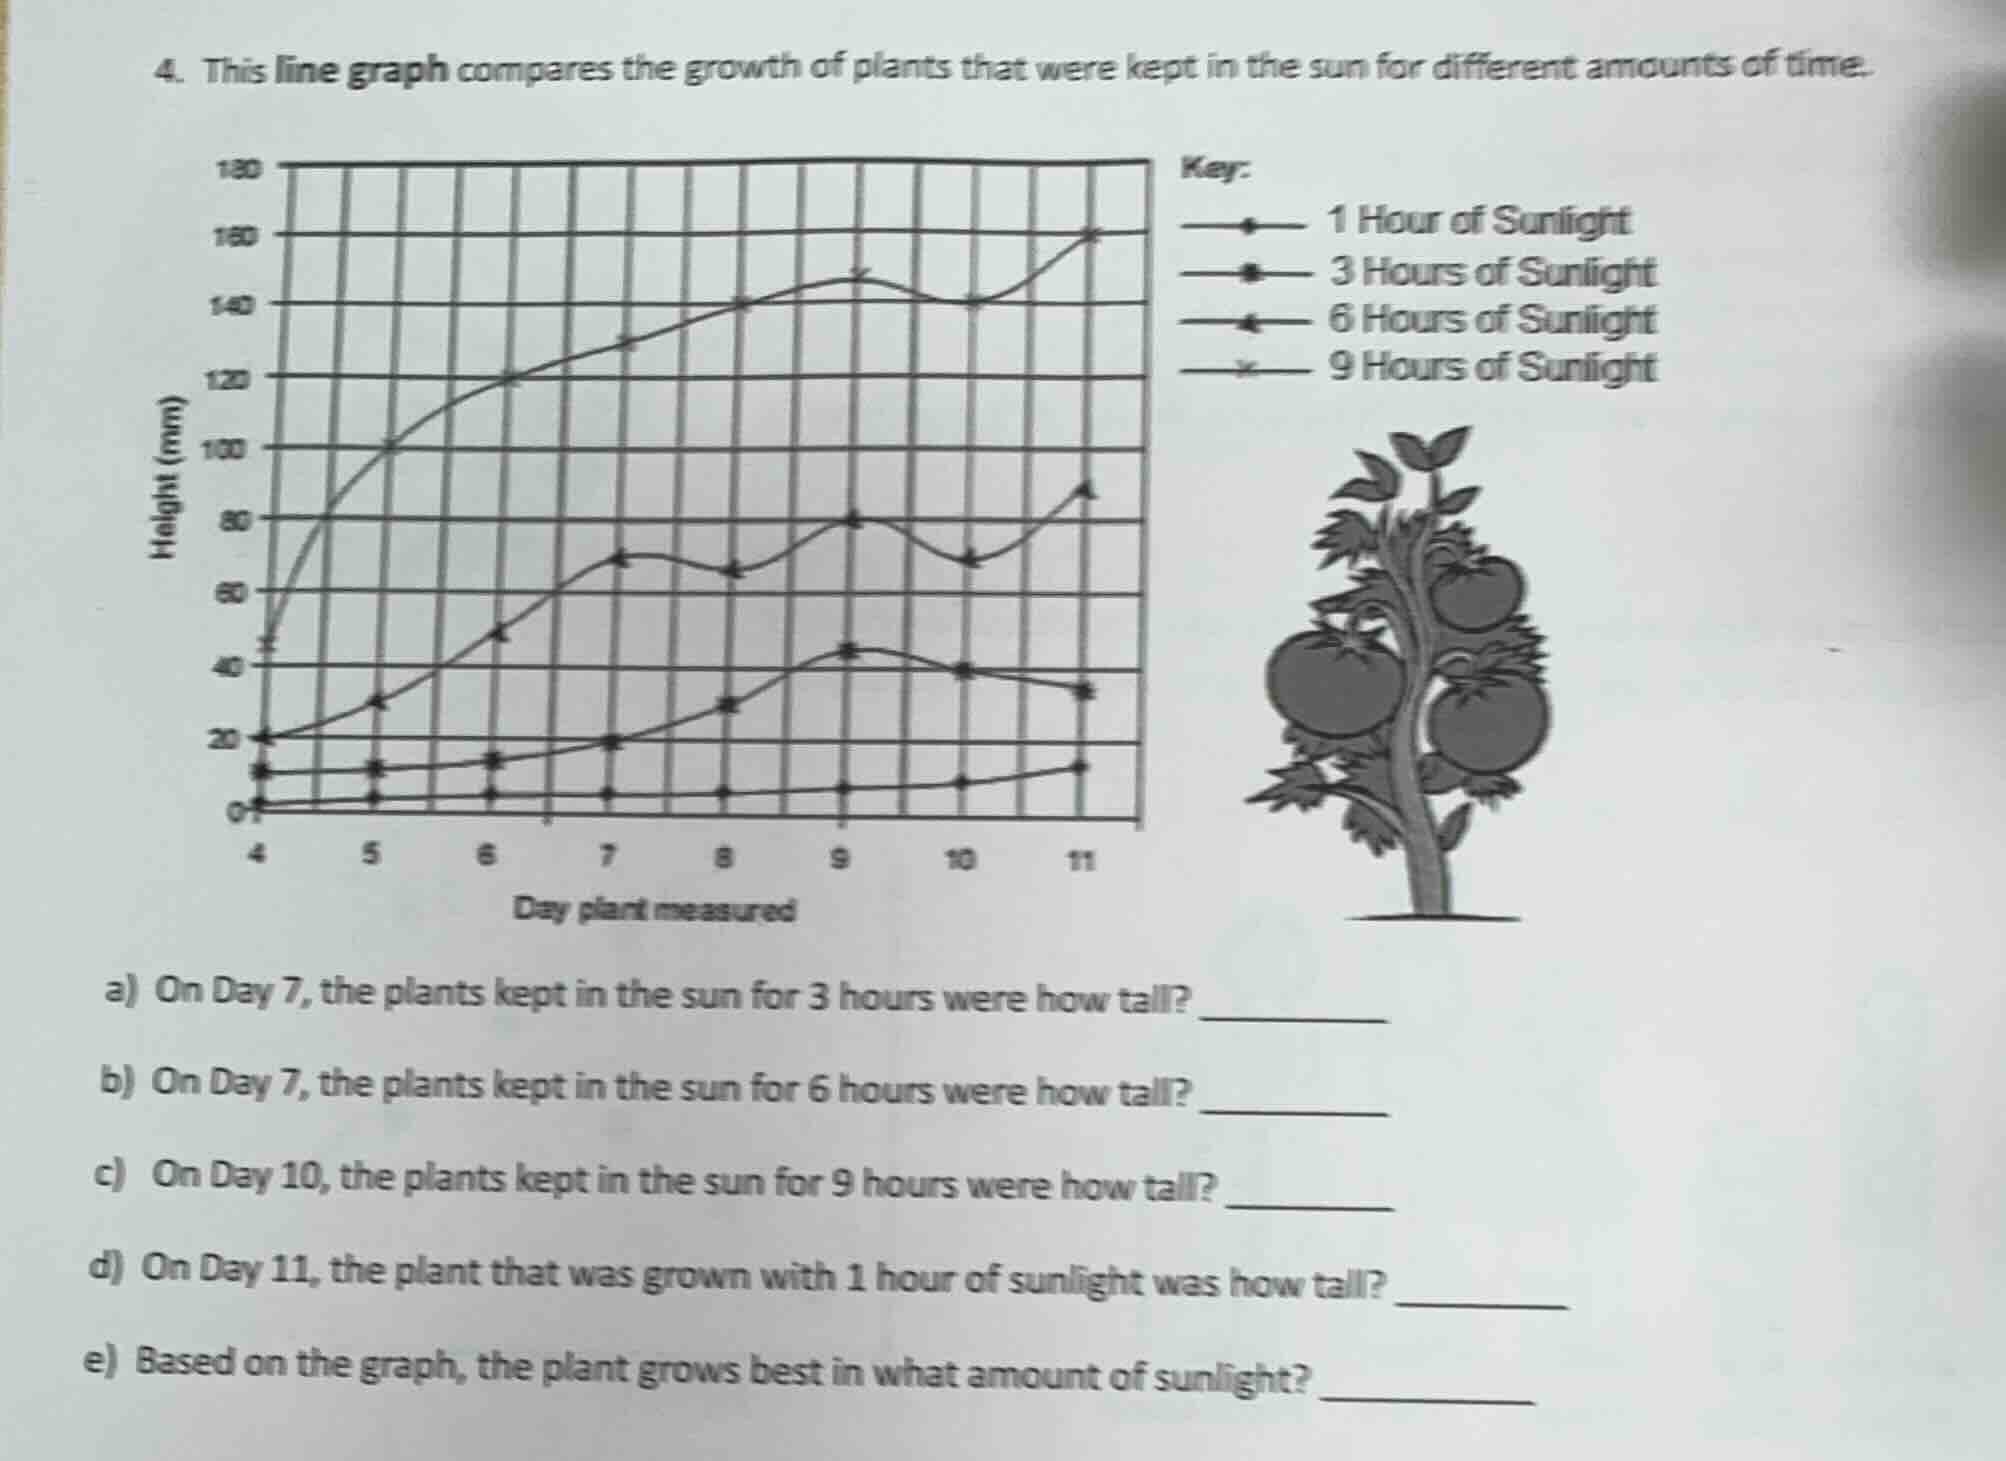
- this line graph compares the growth of plants that were kept in the sun for different amounts of time.
key:
1 hour of sunlight
3 hours of sunlight
6 hours of sunlight
9 hours of sunlight
height (mm)
day plant measured
a) on day 7, the plants kept in the sun for 3 hours were how tall?
b) on day 7, the plants kept in the sun for 6 hours were how tall?
c) on day 10, the plants kept in the sun for 9 hours were how tall?
d) on day 11, the plant that was grown with 1 hour of sunlight was how tall?
e) based on the graph, the plant grows best in what amount of sunlight?
Step1: Locate Day7, 3hrs sunlight
Find intersection of Day7 x-axis and 3hrs line: height = 20 mm
Step2: Locate Day7, 6hrs sunlight
Find intersection of Day7 x-axis and 6hrs line: height = 70 mm
Step3: Locate Day10, 9hrs sunlight
Find intersection of Day10 x-axis and 9hrs line: height = 140 mm
Step4: Locate Day11, 1hr sunlight
Find intersection of Day11 x-axis and 1hr line: height = 12 mm
Step5: Compare max heights of all lines
9hrs sunlight line has highest final height (160 mm on Day11)

Snap & solve any problem in the app
Get step-by-step solutions on Sovi AI
Photo-based solutions with guided steps
Explore more problems and detailed explanations
a) 20 mm
b) 70 mm
c) 140 mm
d) 12 mm
e) 9 Hours of Sunlight