QUESTION IMAGE
Question
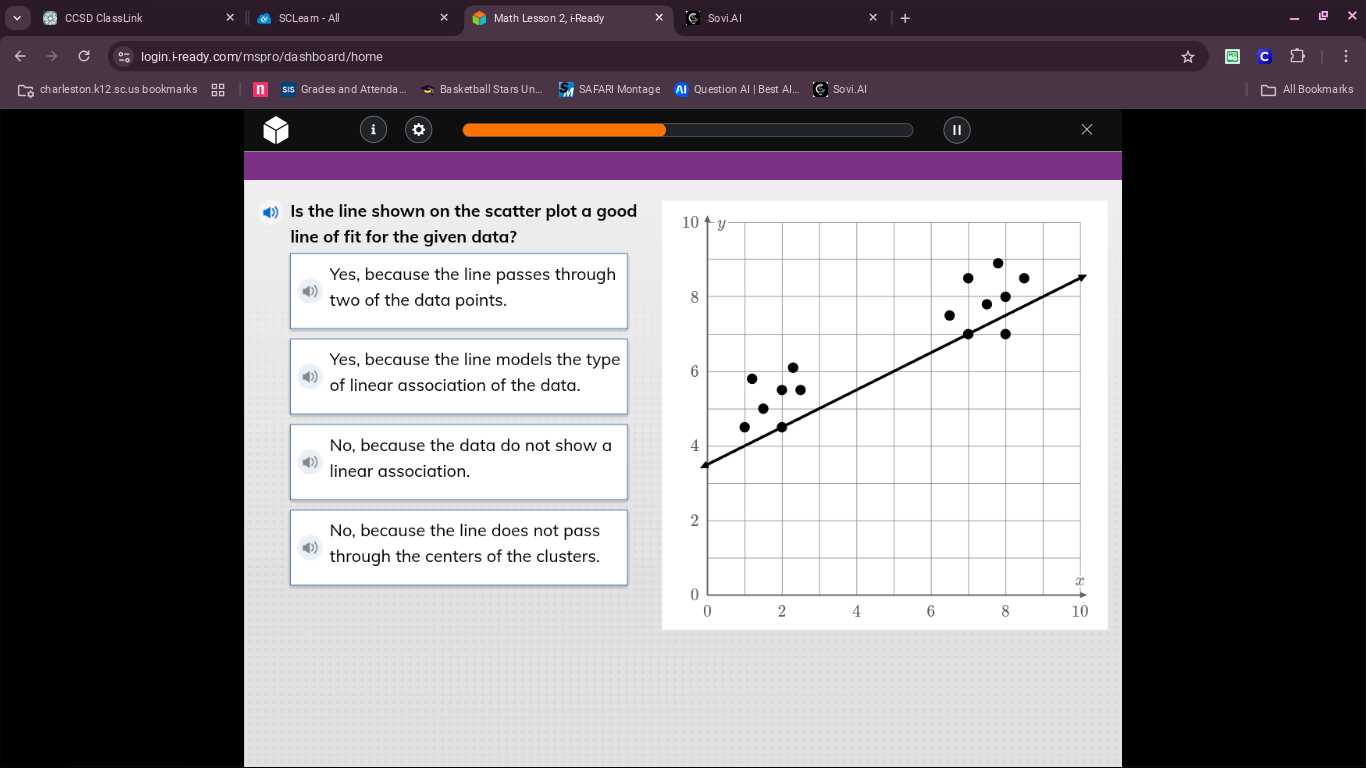
is the line shown on the scatter plot a good line of fit for the given data?
yes, because the line passes through two of the data points.
yes, because the line models the type of linear association of the data.
no, because the data do not show a linear association.
no, because the line does not pass through the centers of the clusters.
To determine if a line is a good line of fit, we check if it models the data's association. The scatter plot shows two clusters (left and right) with a positive linear trend. The line passes through the centers of these clusters (the middle of the left cluster's points and the middle of the right cluster's points) and follows the linear association. Let's analyze each option:
- Option 1: A good line of fit isn't defined by passing through two points; it should model the trend. Eliminate.
- Option 2: The data has a linear association (points trend up), and the line models this linear association. This is correct.
- Option 3: The data does show a linear association (positive trend). Eliminate.
- Option 4: The line does pass through the centers of the clusters (left cluster's center and right cluster's center). Eliminate.

Snap & solve any problem in the app
Get step-by-step solutions on Sovi AI
Photo-based solutions with guided steps
Explore more problems and detailed explanations
B. Yes, because the line models the type of linear association of the data.