QUESTION IMAGE
Question
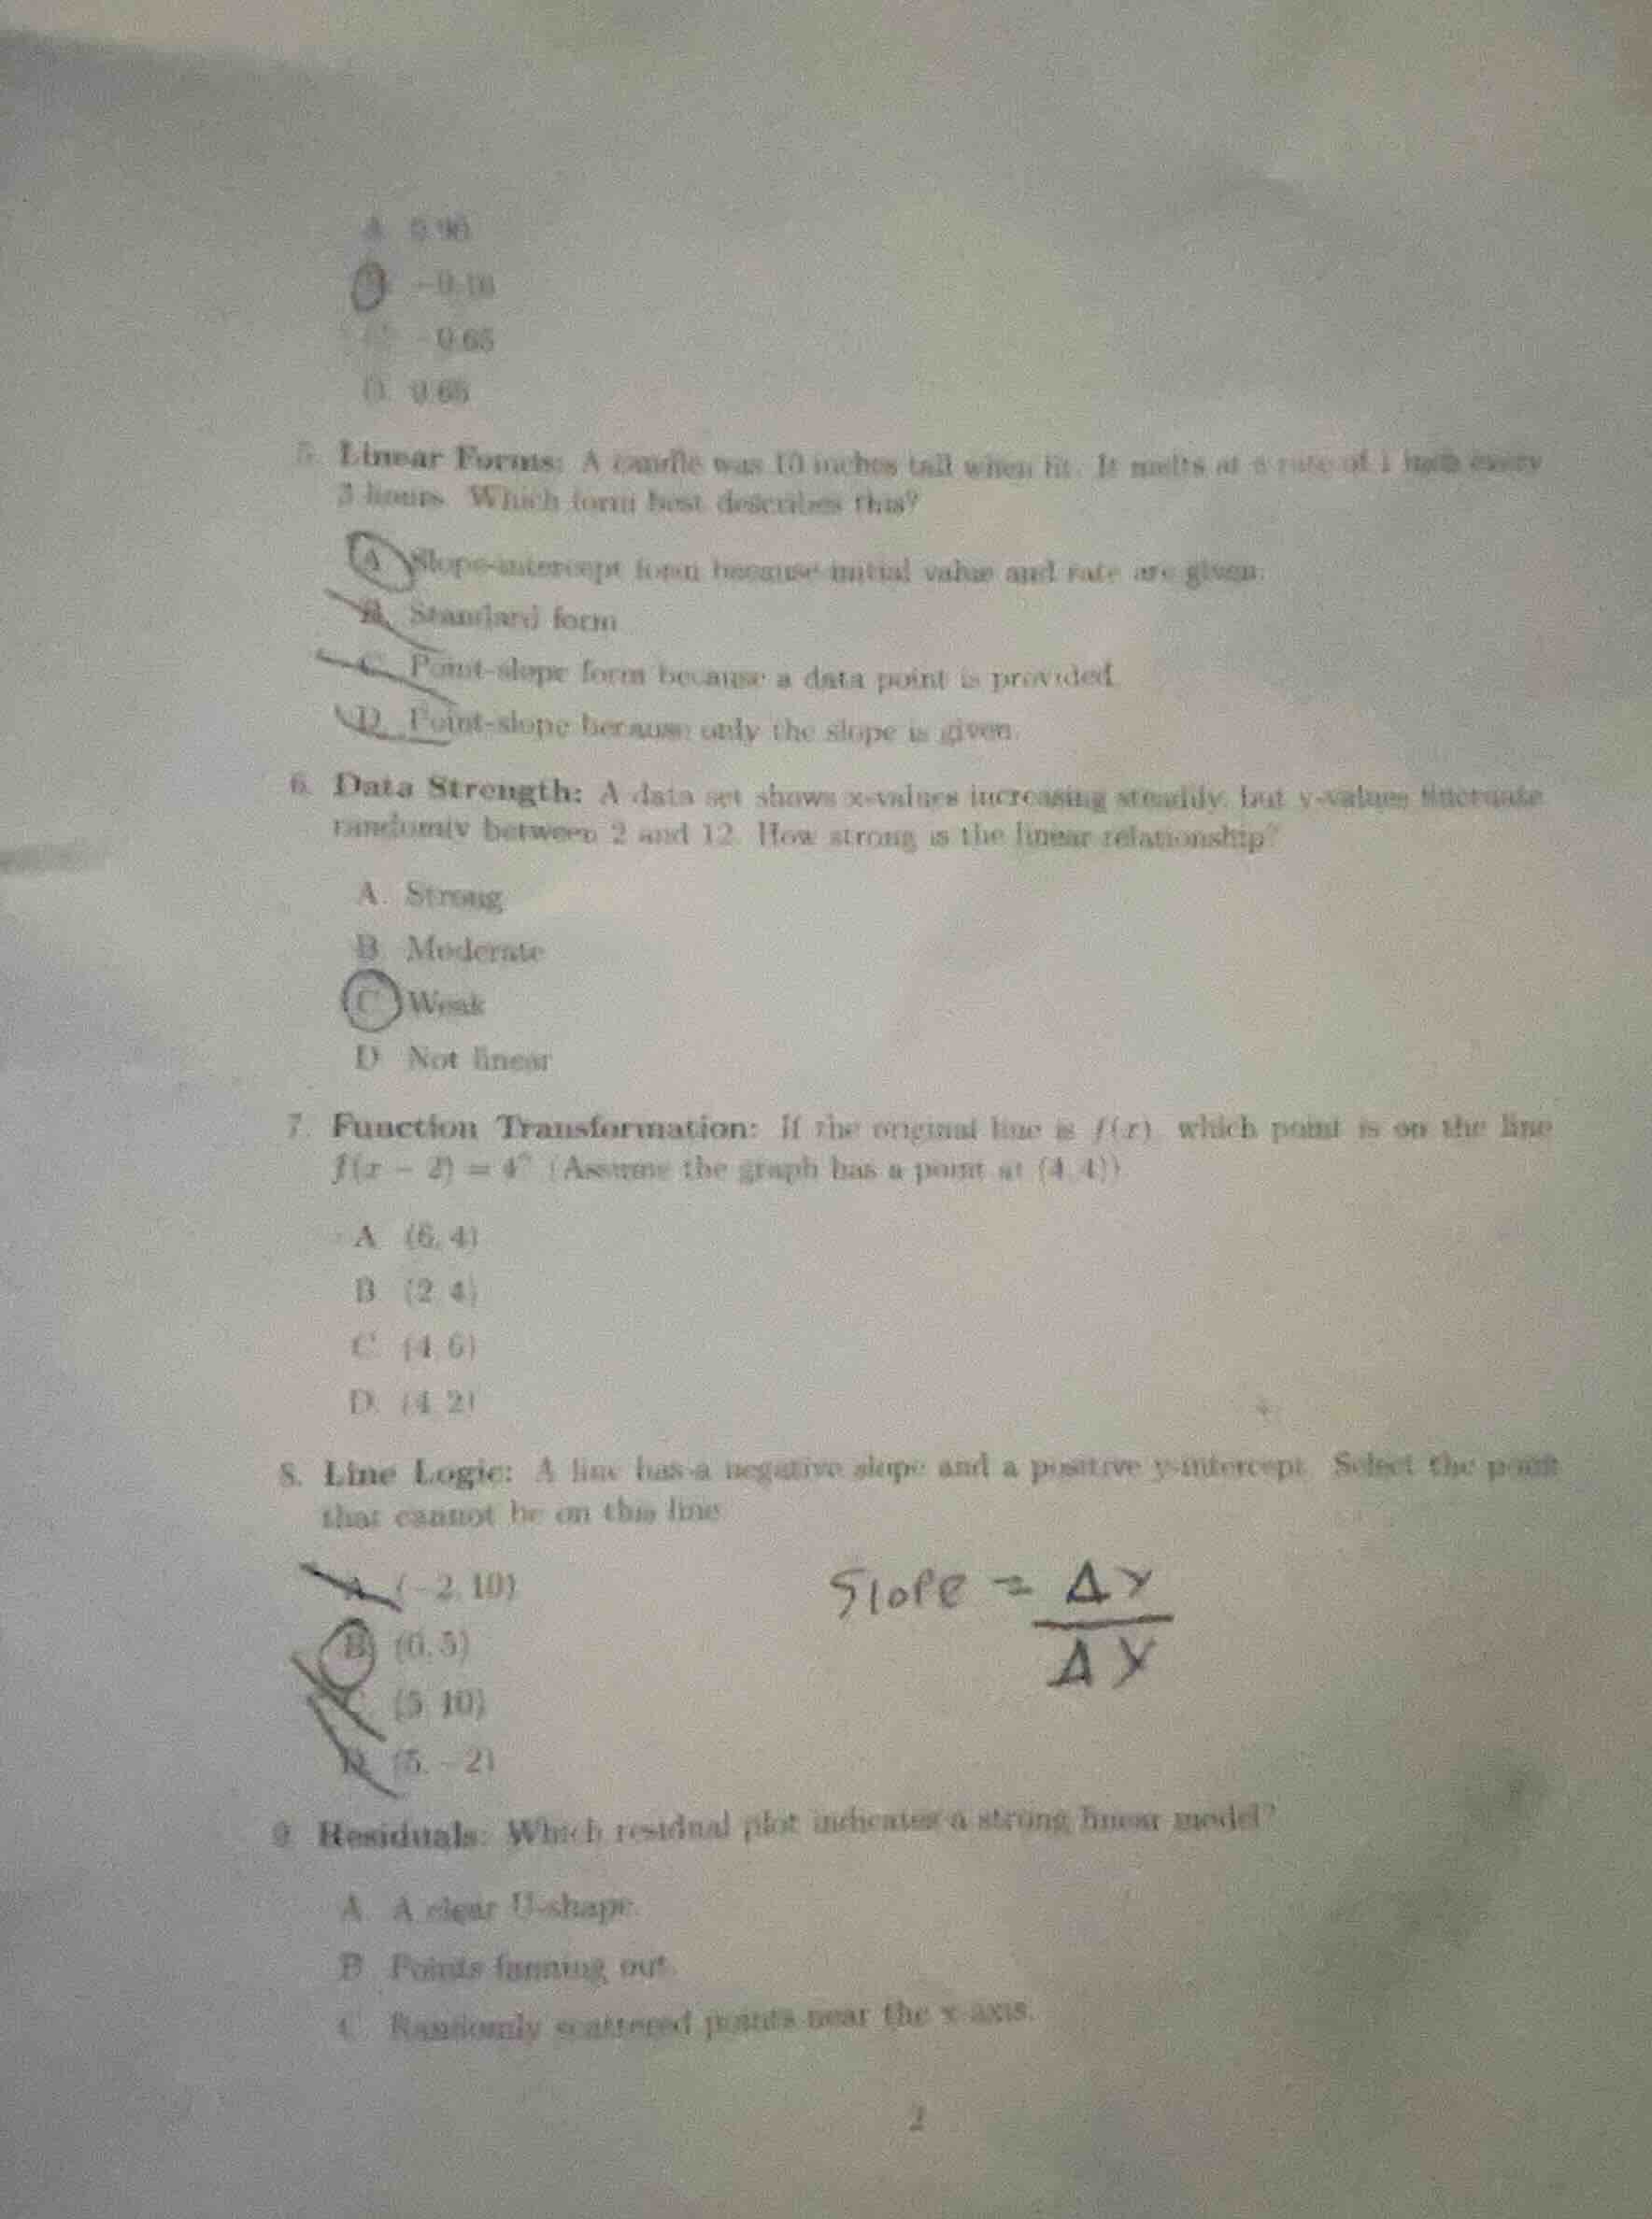
- linear forms: a candle was 10 inches tall when lit. it melts at a rate of 1 inch every 3 hours. which form best describes this?
a slope - intercept form because initial value and rate are given.
b standard form
c point - slope form because a data point is provided.
d point - slope because only the slope is given.
- data strength: a data set shows x - values increasing steadily, but y - values fluctuate randomly between 2 and 12. how strong is the linear relationship?
a. strong
b moderate
c weak
d not linear
- function transformation: if the original line is f(x), which point is on the line f(x - 2)=4? (assume the graph has a point at (4,4))
a (6,4)
b (2,4)
c (4,6)
d (4,2)
- line logic: a line has a negative slope and a positive y - intercept. select the point that cannot be on this line
a (-2,10)
b (6,5)
c (5,10)
d (5, - 2)
- residuals: which residual plot indicates a strong linear model?
a a clear u - shape.
b points fanning out.
c randomly scattered points near the x - axis.
Question 5: Linear Forms
The candle's initial height (10 inches) is the y - intercept, and the rate of melting (1 inch every 3 hours) is the slope. The slope - intercept form of a linear equation is \(y = mx + b\), where \(m\) is the slope and \(b\) is the y - intercept. Since we have the initial value (\(b\)) and the rate (\(m\)), the slope - intercept form is appropriate. Standard form is \(Ax+By = C\), point - slope form is \(y - y_1=m(x - x_1)\) (which requires a point \((x_1,y_1)\) and slope, not just initial value and rate). So option A is correct.
For a linear relationship, as \(x\) increases, \(y\) should show a consistent (increasing or decreasing) pattern. Here, \(x\) increases steadily but \(y\) fluctuates randomly between 2 and 12. A weak linear relationship occurs when there is a very loose association between \(x\) and \(y\). Since \(y\) is random, the linear relationship is weak. It's not “not linear” because \(x\) is increasing steadily, but the \(y\) variation is random, so the linear association is weak.
Step 1: Recall function transformation rule
For a function \(y = f(x - h)\), the graph of \(f(x)\) is shifted \(h\) units to the right. We know that \(f(4)=4\) (since the point \((4,4)\) is on \(y = f(x)\)).
Step 2: Find \(x\) for \(f(x - 2)\)
We want to find \(x\) such that \(x-2 = 4\). Solving for \(x\), we add 2 to both sides of the equation \(x-2=4\), so \(x=4 + 2=6\). When \(x = 6\), \(f(6 - 2)=f(4)=4\). So the point \((6,4)\) is on the line \(f(x - 2)=4\).

Snap & solve any problem in the app
Get step-by-step solutions on Sovi AI
Photo-based solutions with guided steps
Explore more problems and detailed explanations
A. Slope - intercept form because initial value and rate are given.