QUESTION IMAGE
Question
linear relationship.
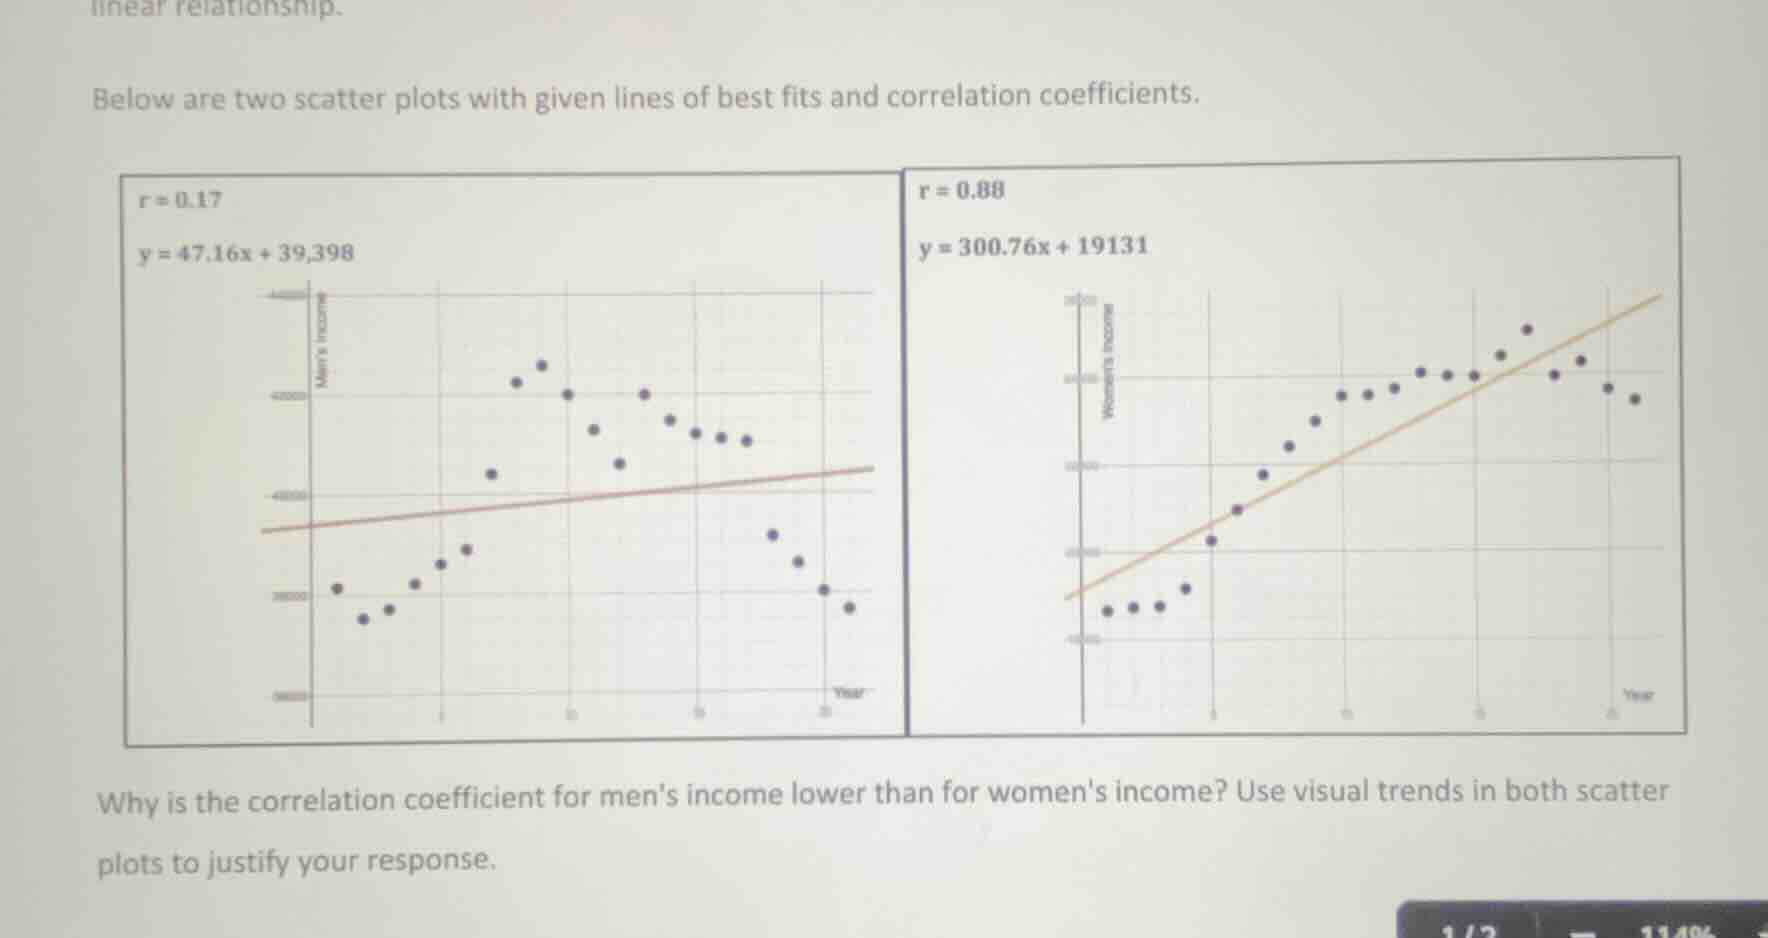
below are two scatter plots with given lines of best fits and correlation coefficients.
why is the correlation coefficient for men’s income lower than for women’s income? use visual trends in both scatter plots to justify your response.
The correlation coefficient measures how closely data points follow the line of best fit. For men’s income (left plot), data points are more scattered around the line, showing less linear trend. For women’s income (right plot), points cluster more closely to the line, indicating a stronger linear relationship. A lower correlation coefficient (0.17 vs. 0.88) means the men’s income data has more variability from the linear trend, while women’s data has less variability and follows the line more closely.

Snap & solve any problem in the app
Get step-by-step solutions on Sovi AI
Photo-based solutions with guided steps
Explore more problems and detailed explanations
The correlation coefficient for men’s income is lower because the data points in the men’s income scatter plot are more widely scattered around the line of best fit (showing less of a linear trend), whereas the data points in the women’s income scatter plot cluster more closely around their line of best fit (showing a stronger linear trend). A lower correlation coefficient indicates less linear association, which matches the more scattered men’s income data.