QUESTION IMAGE
Question
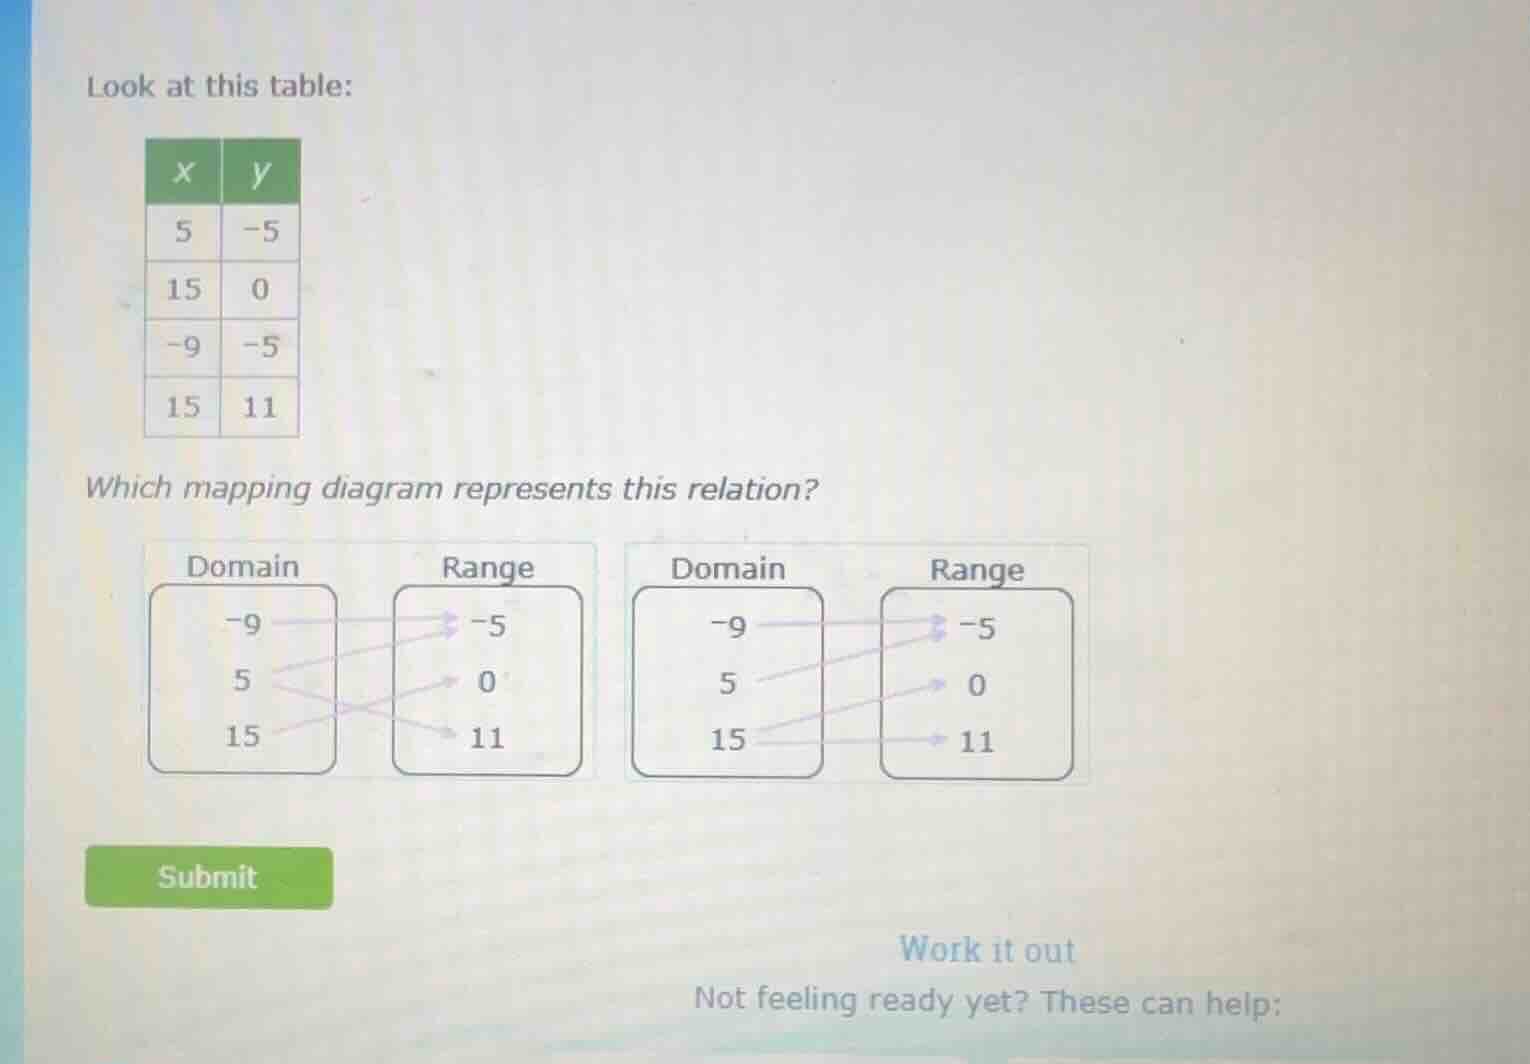
look at this table:
| x | y |
| 5 | -5 |
| 15 | 0 |
| -9 | -5 |
| 15 | 11 |
which mapping diagram represents this relation?
two mapping diagrams with domain and range are shown, but their specific connection details are omitted here as per requirements
Step1: Analyze the table data
From the table, we have the pairs: \((5, -5)\), \((15, 0)\), \((-9, -5)\), \((15, 11)\). So the domain values are \(-9\), \(5\), \(15\) and the range values are \(-5\), \(0\), \(11\).
Step2: Check the mappings
- For \(x = -9\), \(y=-5\) (so a line from \(-9\) to \(-5\)).
- For \(x = 5\), \(y = -5\) (so a line from \(5\) to \(-5\)).
- For \(x = 15\), \(y = 0\) and \(y = 11\) (so lines from \(15\) to \(0\) and \(15\) to \(11\)).
Looking at the two mapping diagrams, the first one has the correct mappings: \(-9\) to \(-5\), \(5\) to \(-5\), \(15\) to \(0\) and \(15\) to \(11\). The second one does not have the correct mapping for \(5\) (it should map to \(-5\) but in the second diagram, \(5\) is not mapped to \(-5\) correctly as per the table).

Snap & solve any problem in the app
Get step-by-step solutions on Sovi AI
Photo-based solutions with guided steps
Explore more problems and detailed explanations
The first mapping diagram (the one on the left) represents the relation.