QUESTION IMAGE
Question
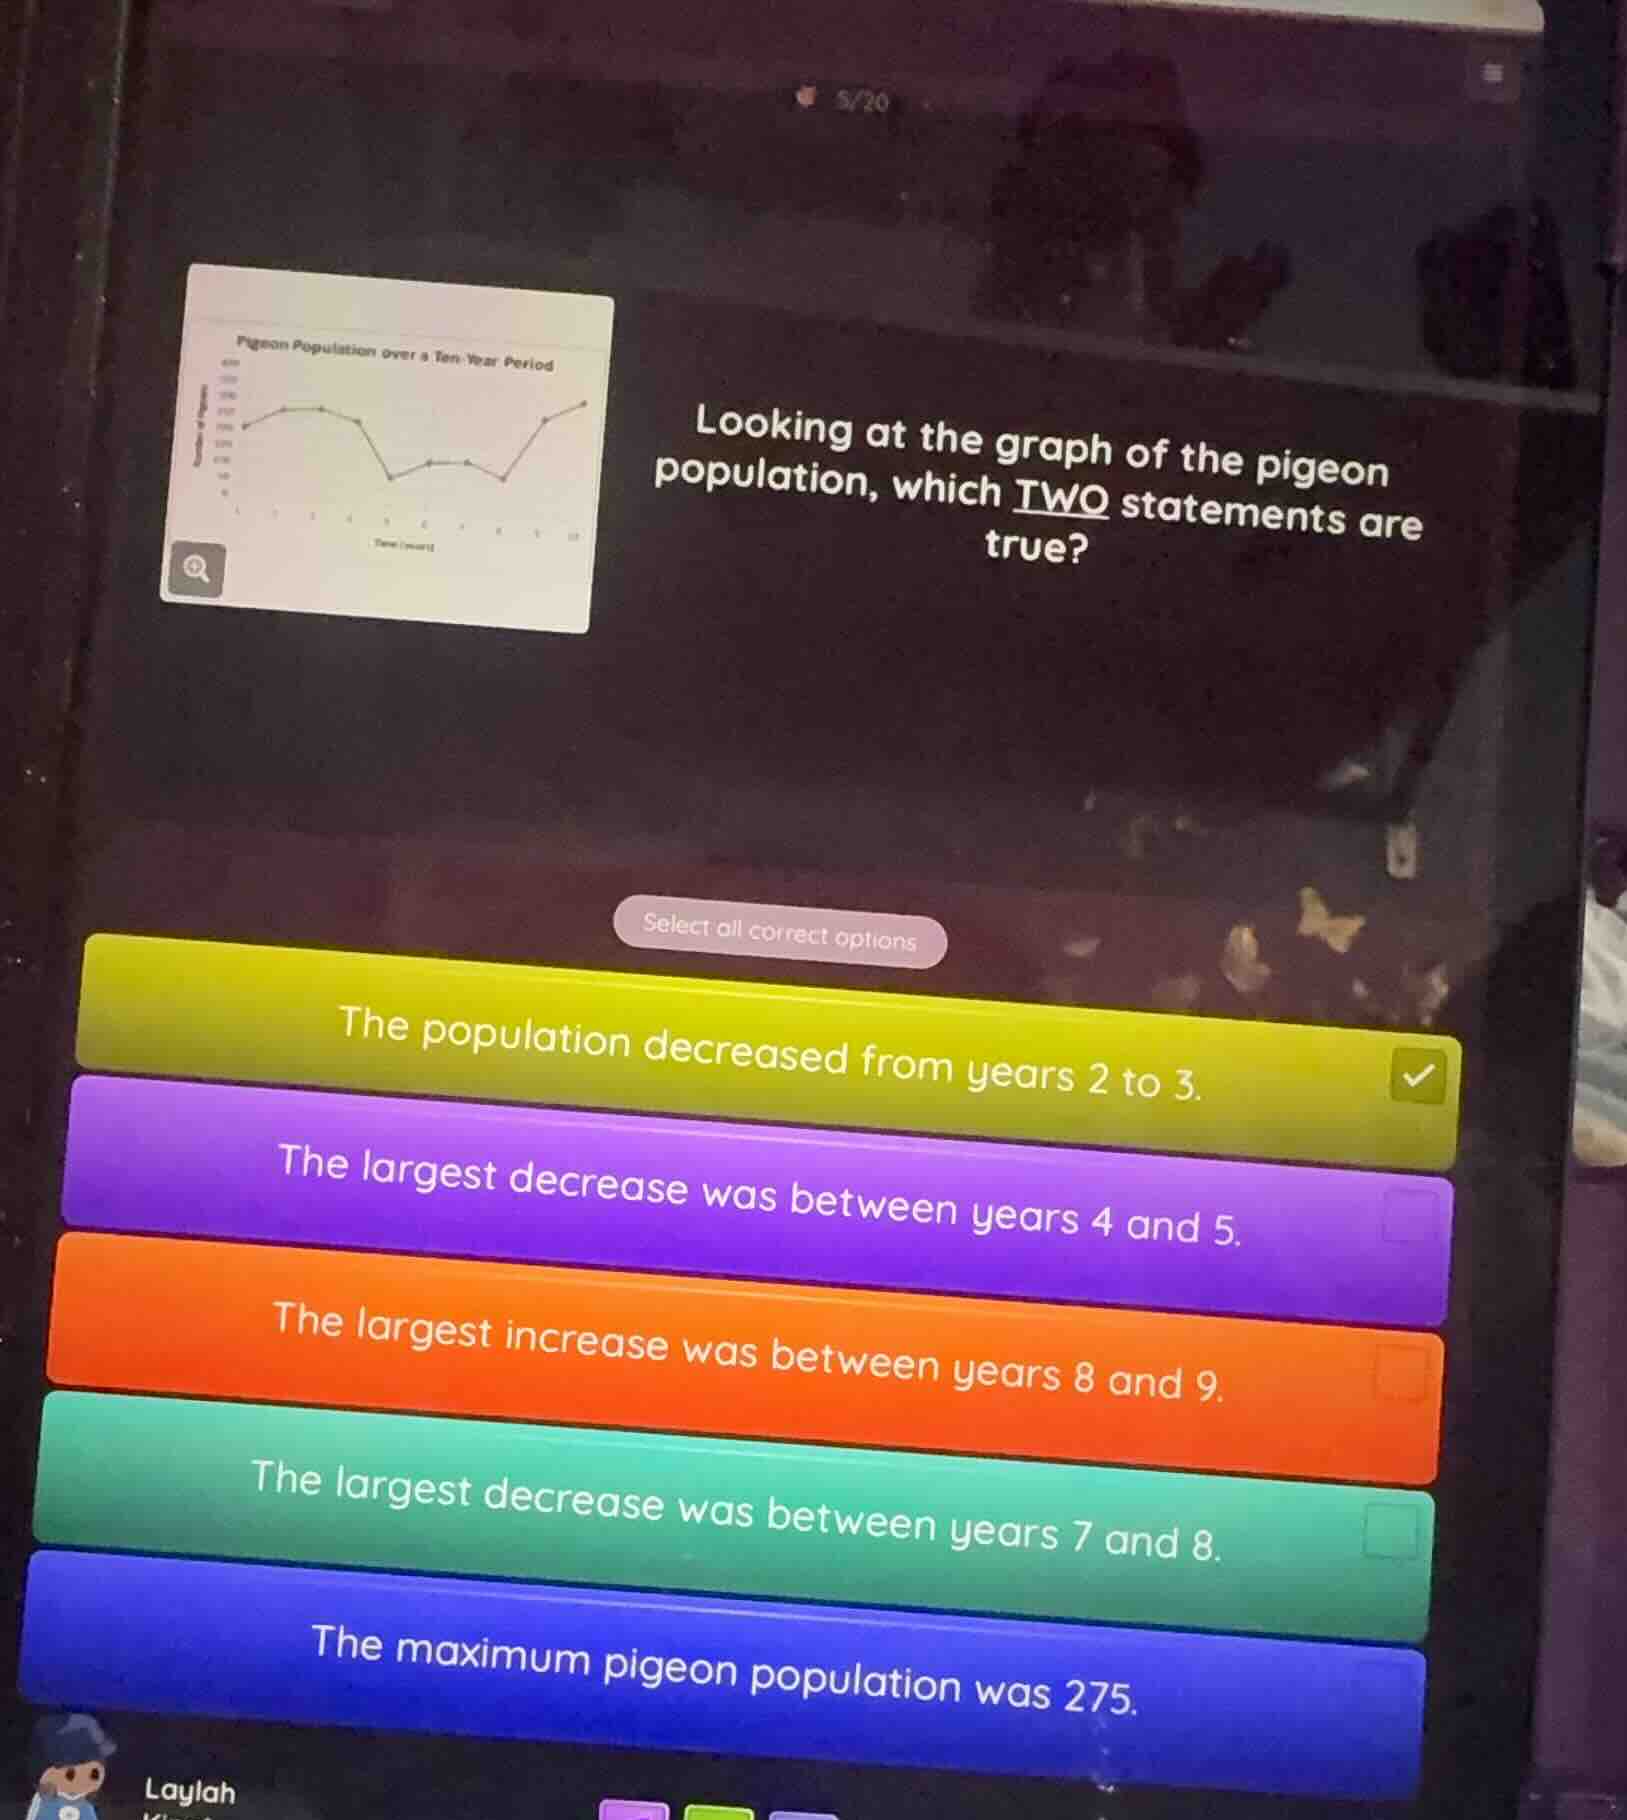
looking at the graph of the pigeon population, which two statements are true? select all correct options the population decreased from years 2 to 3. the largest decrease was between years 4 and 5. the largest increase was between years 8 and 9. the largest decrease was between years 7 and 8. the maximum pigeon population was 275.
Brief Explanations
- Analyze "The population decreased from years 2 to 3": From the graph's trend (assuming the x - axis is years and y - axis is population), if the graph shows a downward slope from year 2 to 3, this is true.
- Analyze "The largest decrease was between years 4 and 5": By visually inspecting the graph (the steepest downward slope), if the slope between 4 and 5 is the steepest among decreasing intervals, this is true.
- Analyze "The largest increase was between years 8 and 9": If the upward slope between 8 and 9 is not the steepest among increasing intervals, this is false.
- Analyze "The largest decrease was between years 7 and 8": If the slope between 7 and 8 is not the steepest among decreasing intervals, this is false.
- Analyze "The maximum pigeon population was 275": If the peak of the graph (maximum y - value) is not 275, this is false.

Snap & solve any problem in the app
Get step-by-step solutions on Sovi AI
Photo-based solutions with guided steps
Explore more problems and detailed explanations
A. The population decreased from years 2 to 3, B. The largest decrease was between years 4 and 5