QUESTION IMAGE
Question
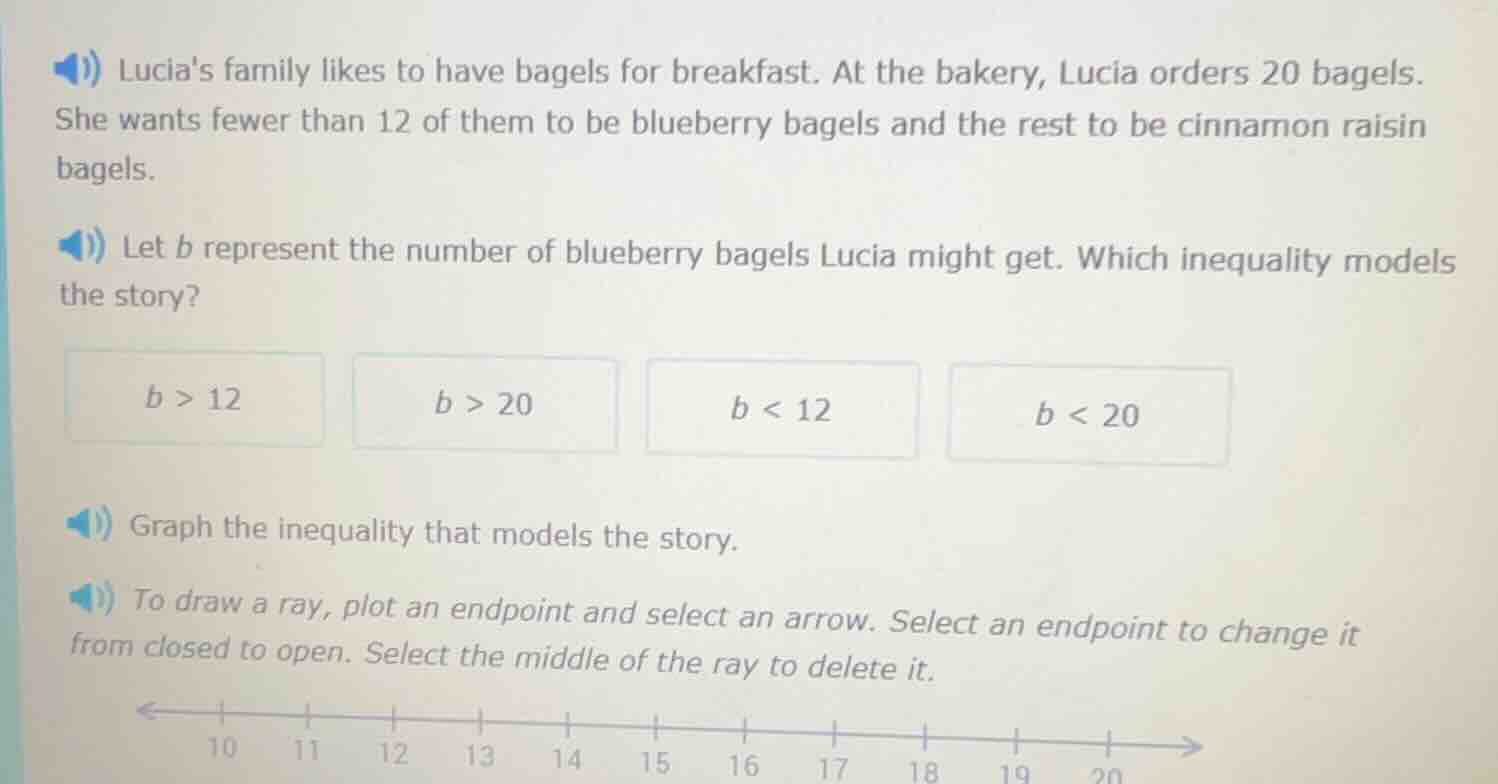
lucias family likes to have bagels for breakfast. at the bakery, lucia orders 20 bagels. she wants fewer than 12 of them to be blueberry bagels and the rest to be cinnamon raisin bagels. let b represent the number of blueberry bagels lucia might get. which inequality models the story? b > 12, b > 20, b < 12, b < 20. graph the inequality that models the story. to draw a ray, plot an endpoint and select an arrow. select an endpoint to change it from closed to open. select the middle of the ray to delete it. (number line from 10 to 20)
Part 1: Choosing the Correct Inequality
The problem states that Lucia wants fewer than 12 blueberry bagels. Let \( b \) be the number of blueberry bagels. "Fewer than 12" translates to the inequality \( b < 12 \). The other options are incorrect: \( b > 12 \) would mean more than 12 (opposite of what's needed), \( b > 20 \) is impossible since she only ordered 20 bagels, and \( b < 20 \) is true but not specific enough (we need the stricter condition of fewer than 12).
Step 1: Identify the endpoint
The inequality is \( b < 12 \), so the endpoint is at 12. Since \( b \) is strictly less than 12 (not equal to 12), we use an open circle at 12.
Step 2: Determine the direction of the ray
We need to show all values of \( b \) that are less than 12. On the number line, values less than 12 are to the left of 12. So we draw a ray starting at the open circle at 12 and pointing to the left (towards lower numbers like 11, 10, etc.).
Graph Description:
- Draw an open circle at the position labeled 12 on the number line.
- Draw a ray (a line with an arrow) starting from the open circle at 12 and extending to the left (towards the numbers 11, 10, 9, etc.).
(Note: Since we can't draw the actual graph here, the description above outlines how to construct it on the given number line.)

Snap & solve any problem in the app
Get step-by-step solutions on Sovi AI
Photo-based solutions with guided steps
Explore more problems and detailed explanations
\( b < 12 \)