QUESTION IMAGE
Question
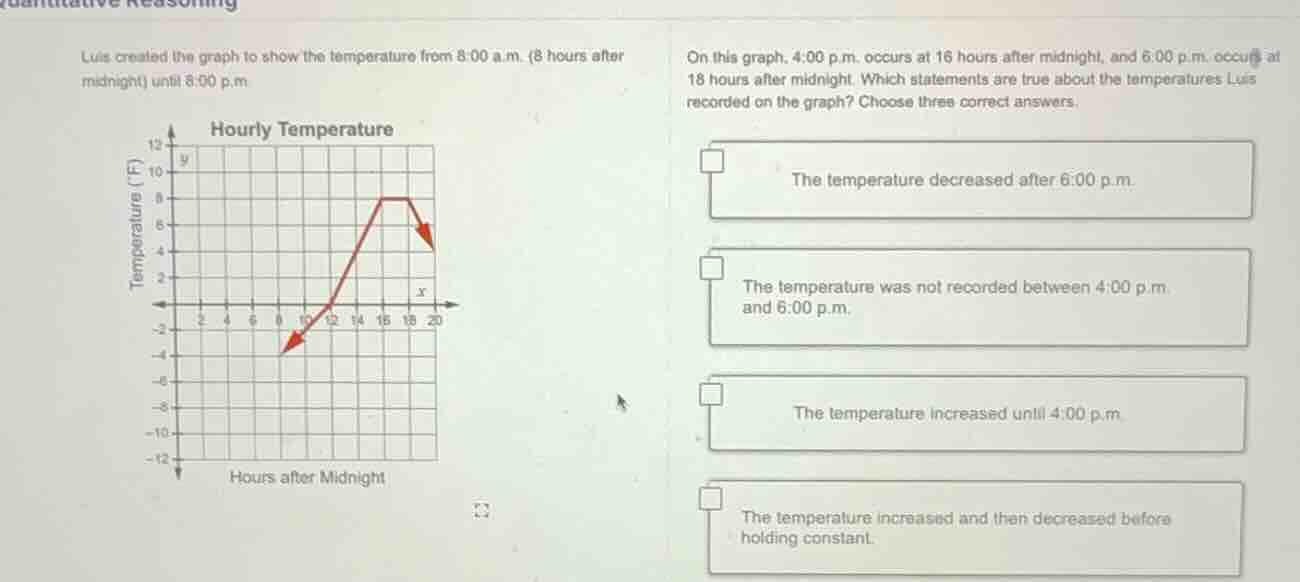
luis created the graph to show the temperature from 8:00 a.m. (8 hours after midnight) until 8:00 p.m.
on this graph, 4:00 p.m. occurs at 16 hours after midnight, and 6:00 p.m. occurs at 18 hours after midnight. which statements are true about the temperatures luis recorded on the graph? choose three correct answers.
the temperature decreased after 6:00 p.m.
the temperature was not recorded between 4:00 p.m. and 6:00 p.m.
the temperature increased until 4:00 p.m.
the temperature increased and then decreased before holding constant.
- For the first statement: The graph shows the temperature drops (red arrow down) after the 18-hour mark (6:00 p.m.), so this is true.
- For the second statement: 4:00 p.m. is 16 hours, 6:00 p.m. is 18 hours. The graph has a flat, constant temperature line between these two points, meaning temperature was recorded (and steady) here, so this statement is false.
- For the third statement: 4:00 p.m. is 16 hours. The graph shows temperature rising (red arrow up) until 16 hours, then stays constant until 18 hours, so this is true.
- For the fourth statement: The graph shows temperature increases first, then stays constant (holds steady) between 16-18 hours, then decreases. It does not decrease before holding constant, so this statement is false.

Snap & solve any problem in the app
Get step-by-step solutions on Sovi AI
Photo-based solutions with guided steps
Explore more problems and detailed explanations
A. The temperature decreased after 6:00 p.m.
C. The temperature increased until 4:00 p.m.