QUESTION IMAGE
Question
- make row 1 bold and centered
- in cell c1, type
\
- in cell c2, enter the formula =count(a:a)
- in cell d1, type \population mean\
- in cell d2, enter the formula =average(a:a)
- in cell e1, type \population sd\
- in cell e2, enter the formula =stdev.p(a:a)
- round the cell range d2:e2 to two decimal places
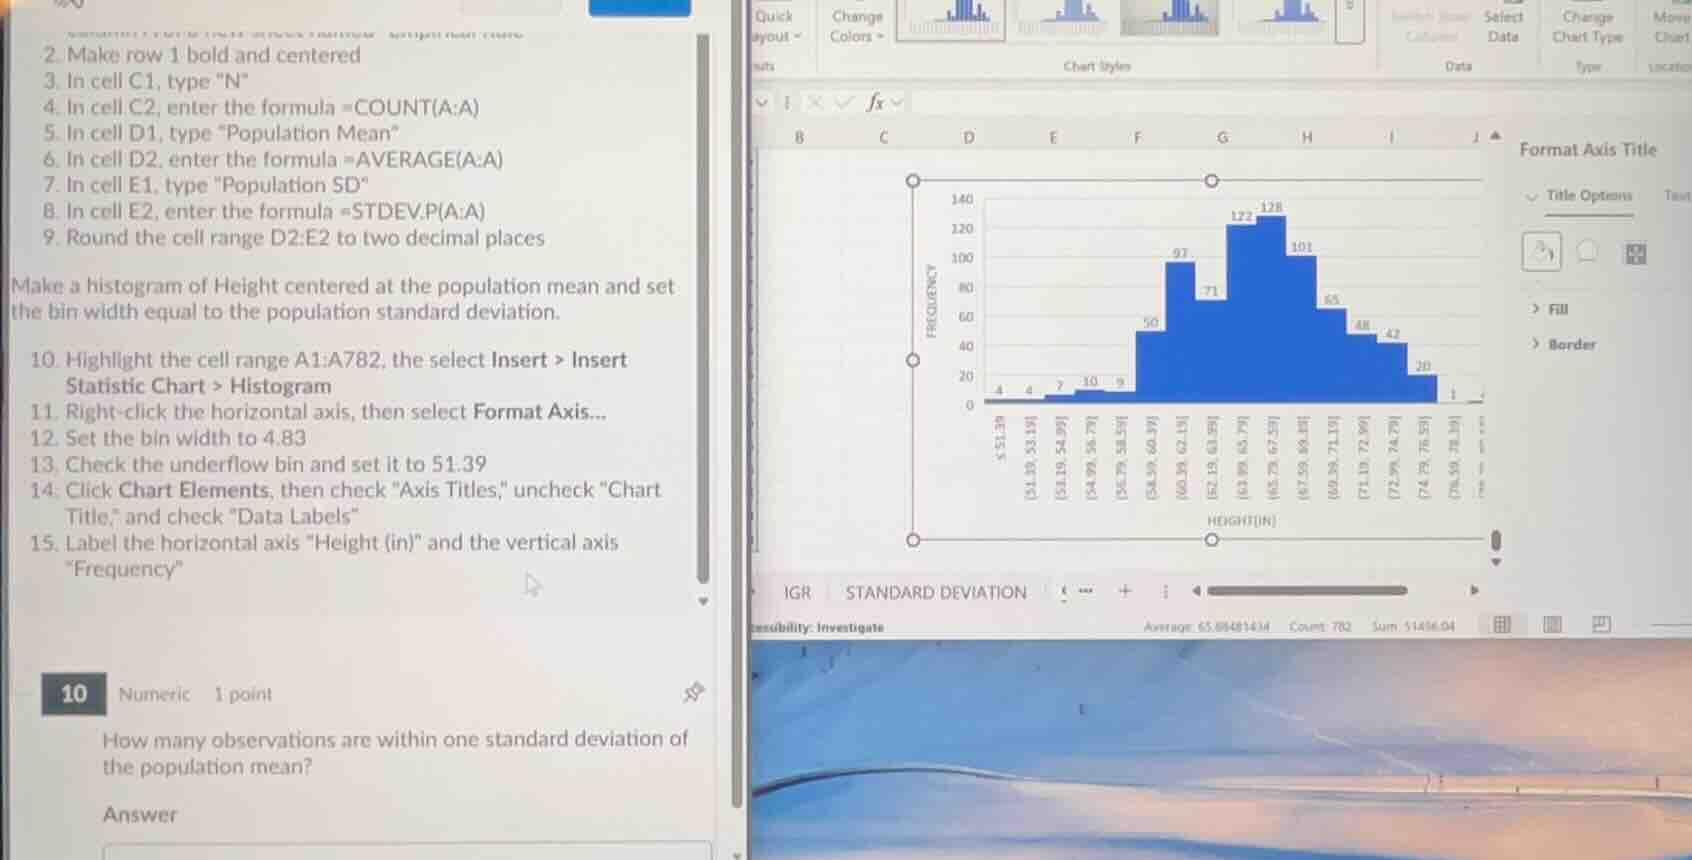
make a histogram of height centered at the population mean and set
the bin width equal to the population standard deviation.
- highlight the cell range a1:a782, the select insert > insert
statistic chart > histogram
- right - click the horizontal axis, then select format axis...
- set the bin width to 4.83
- check the underflow bin and set it to 51.39
- click chart elements, then check \axis titles,\ uncheck \chart
title,\ and check \data labels\
- label the horizontal axis \height (in)\ and the vertical axis
\frequency\
10
numeric 1 point
how many observations are within one standard deviation of
the population mean?
Step1: Identify target bins
One standard deviation from the mean is $\text{Mean} \pm \text{SD}$. From the chart, the mean is ~65.89, SD=4.83, so range is $65.89-4.83=61.06$ to $65.89+4.83=70.72$. The bins in this range are (61.19-63.19), (63.19-65.19), (65.19-67.19), (67.19-69.19).
Step2: Sum bin frequencies
Add the frequencies of these bins: $97 + 122 + 128 + 101$
<Expression>
$97 + 122 + 128 + 101 = 448$
</Expression>

Snap & solve any problem in the app
Get step-by-step solutions on Sovi AI
Photo-based solutions with guided steps
Explore more problems and detailed explanations
448