QUESTION IMAGE
Question
making inferences
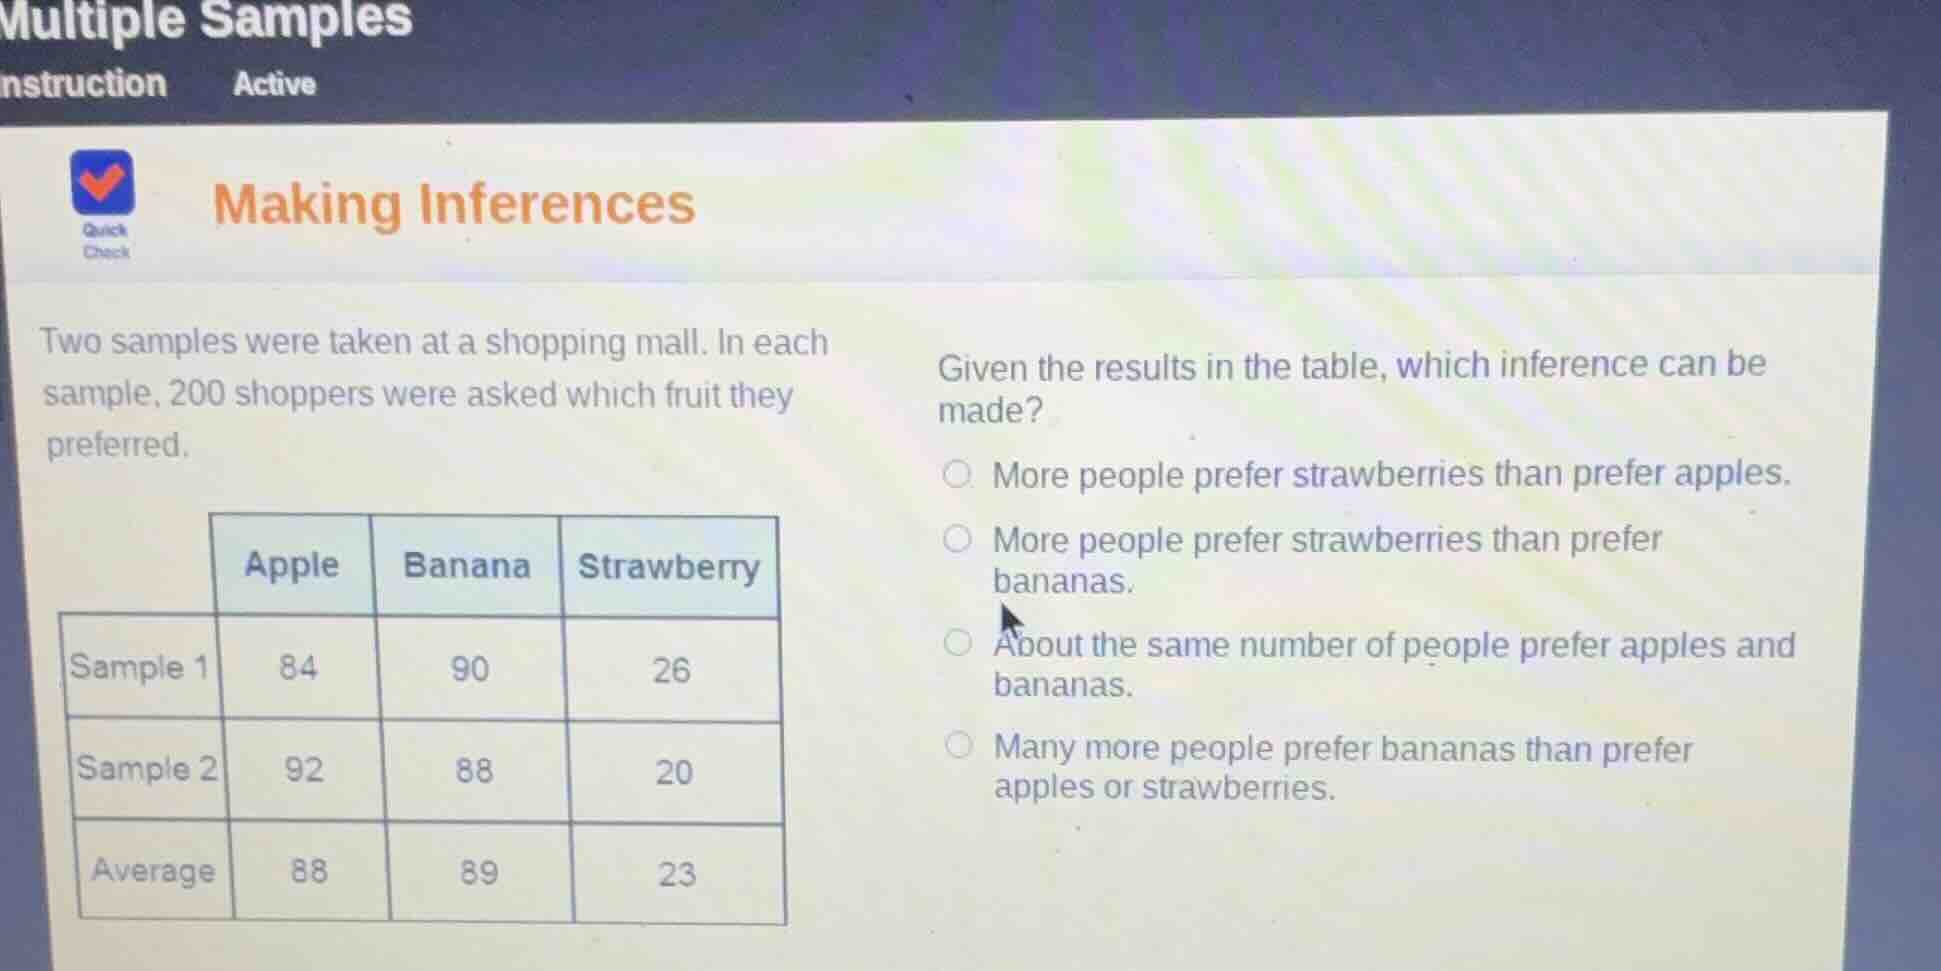
two samples were taken at a shopping mall. in each sample, 200 shoppers were asked which fruit they preferred.
| apple | banana | strawberry | |
|---|---|---|---|
| sample 2 | 92 | 88 | 20 |
| average | 88 | 89 | 23 |
given the results in the table, which inference can be made?
○ more people prefer strawberries than prefer apples.
○ more people prefer strawberries than prefer bananas.
○ about the same number of people prefer apples and bananas.
○ many more people prefer bananas than prefer apples or strawberries.
Step1: Calculate total preferences
Sample1 + Sample2 totals:
Apple: $84 + 92 = 176$
Banana: $90 + 88 = 178$
Strawberry: $26 + 20 = 46$
Step2: Evaluate each option
- Option1: 46 < 176 → False
- Option2: 46 < 178 → False
- Option3: 176 ≈ 178 → True
- Option4: 178 is not "many more" than 176 → False

Snap & solve any problem in the app
Get step-by-step solutions on Sovi AI
Photo-based solutions with guided steps
Explore more problems and detailed explanations
C. About the same number of people prefer apples and bananas.