QUESTION IMAGE
Question
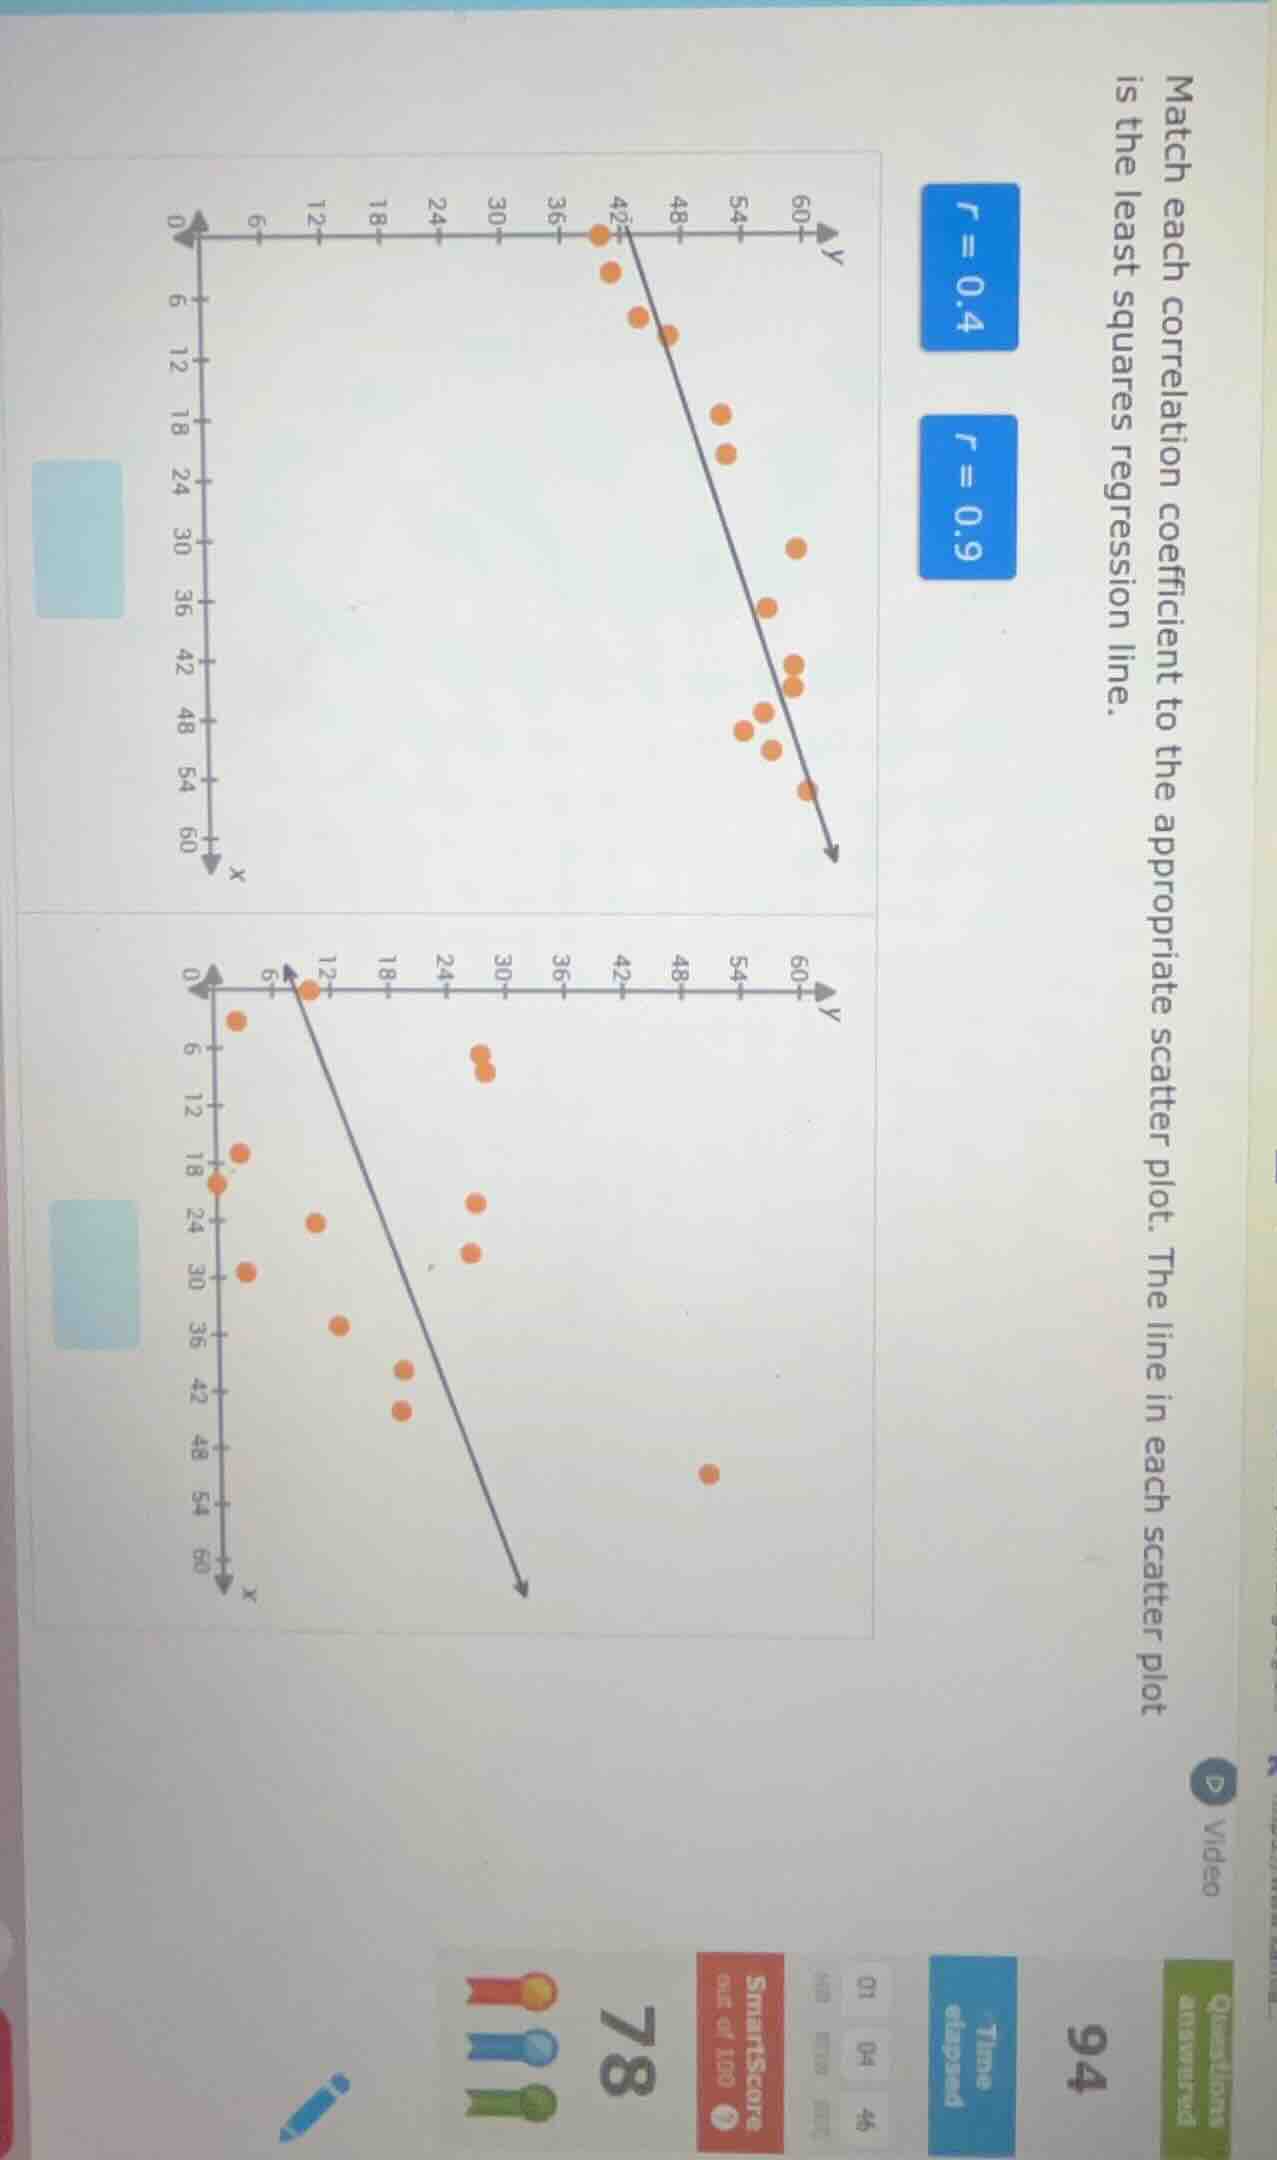
match each correlation coefficient to the appropriate scatter plot. the line in each scatter plot is the least squares regression line.
r = 0.4
r = 0.9
Step1: Relate r to point clustering
The correlation coefficient \(r\) (range: \(-1\) to \(1\)) measures how closely data points cluster around the regression line. A value closer to \(1\) means tighter clustering.
Step2: Analyze top scatter plot
Points cluster tightly near the regression line, so this plot matches \(r = 0.9\) (a strong positive correlation).
Step3: Analyze bottom scatter plot
Points are widely spread from the regression line, so this plot matches \(r = 0.4\) (a weak positive correlation).

Snap & solve any problem in the app
Get step-by-step solutions on Sovi AI
Photo-based solutions with guided steps
Explore more problems and detailed explanations
Top scatter plot: \(r = 0.9\)
Bottom scatter plot: \(r = 0.4\)