QUESTION IMAGE
Question
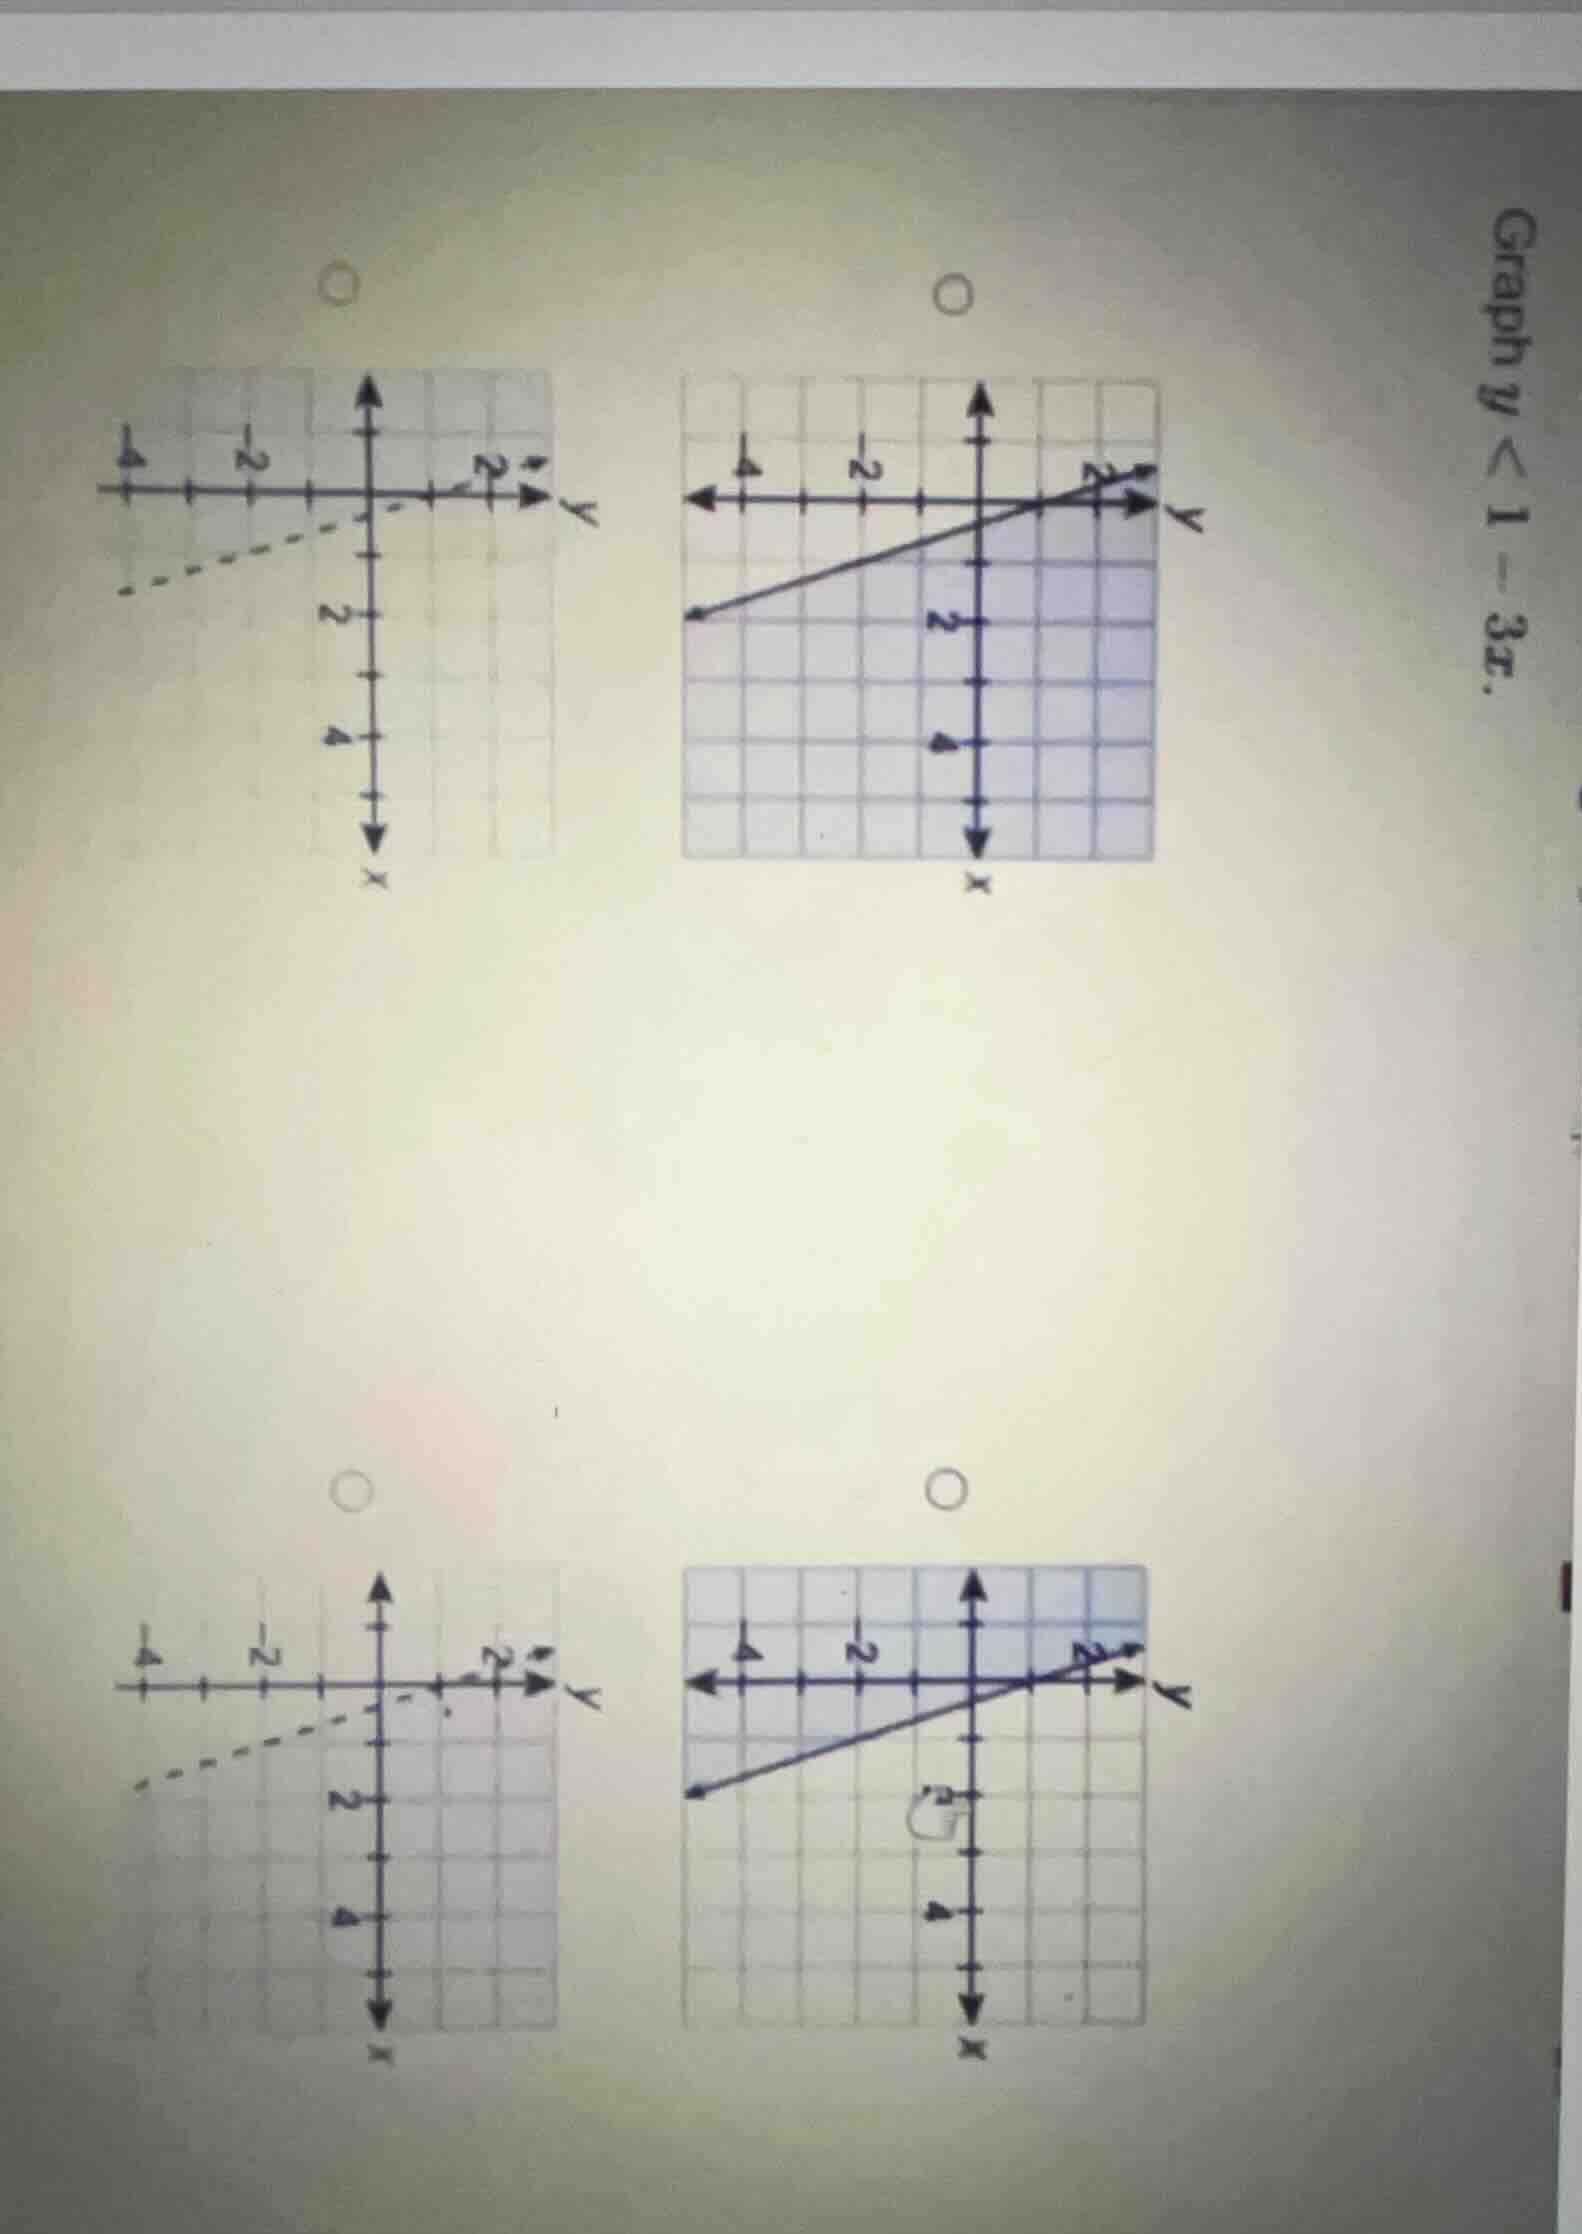
graph $y < 1 - 3x$.
Step1: Analyze the inequality form
The inequality is \( y < 1 - 3x \), which is in slope - intercept form \( y=mx + b \), where the slope \( m=- 3 \) and the y - intercept \( b = 1 \).
Step2: Determine the boundary line
Since the inequality is strict (\(<\) instead of \(\leq\)), the boundary line \( y=1 - 3x \) should be a dashed line.
Step3: Analyze the slope and intercept for graphing
- For the y - intercept, when \( x = 0 \), \( y=1 \), so the line passes through the point \((0,1)\).
- The slope \( m=-3=\frac{-3}{1}\), which means for every 1 unit we move to the right along the x - axis, we move 3 units down along the y - axis. So from the point \((0,1)\), if we move \( x = 1 \), \( y=1-3(1)=- 2 \), so the line also passes through \((1, - 2)\).
- Since the inequality is \( y <1 - 3x \), we shade the region below the dashed line \( y = 1-3x \).
Now, let's analyze the given graphs:
- The first graph (top - left) has a dashed line. Let's check the equation of the line. The slope and intercept should match \( y = 1-3x \). The y - intercept seems to be around 1? Wait, no, looking at the axes, the top - left graph's dashed line: when \( x = 0 \), \( y\) - value? Wait, maybe I mis - look. Wait, the bottom - left graph: let's check the dashed line. Wait, the correct graph should have a dashed line (because of \( < \)) with slope - 3 and y - intercept 1, and shading below.
Wait, let's re - express the steps for graphing:
- Graph the boundary line: The equation of the boundary line is \( y=1 - 3x \). Since the inequality is strict (\(y <1 - 3x\)), we draw a dashed line.
- Find two points on the line \( y = 1-3x \):
- When \( x = 0 \), \( y=1-3(0)=1\), so the point is \((0,1)\).
- When \( x = 1 \), \( y=1 - 3(1)=-2\), so the point is \((1,-2)\).
- Determine the shading region: We test a point not on the line, say \((0,0)\). Substitute into the inequality \( y<1 - 3x \): \( 0<1-3(0)\), which is \( 0 < 1 \), a true statement. So we shade the region that contains the point \((0,0)\), which is the region below the line \( y = 1-3x \).
Now, looking at the four graphs:
- The top - right and bottom - right graphs have solid lines, which are incorrect because the inequality is strict (\( < \)), so we can eliminate them.
- Now, between the top - left and bottom - left graphs:
- The line \( y = 1-3x \) has a slope of - 3. Let's check the slope of the dashed line in the bottom - left graph. From the y - intercept (which should be 1), if we move \( x = 1 \), \( y\) should be - 2. In the bottom - left graph, the dashed line seems to have a slope that is less steep? Wait, no, maybe the top - left graph: Wait, maybe I made a mistake. Wait, the correct graph should have a dashed line with slope - 3 and y - intercept 1, and shading below. Let's check the bottom - left graph: the dashed line, when \( x = 0 \), \( y\) is around 1? Wait, the axes: the y - axis has positive upwards, x - axis positive to the right. The bottom - left graph's dashed line: when \( x = 0 \), \( y\) is 1? And when \( x = 1 \), \( y=-2\)? Let's see the grid. Each square is 1 unit. So from \((0,1)\), moving right 1 unit (x = 1) and down 3 units (y = 1 - 3=-2), so the point \((1,-2)\) is on the line. The bottom - left graph's dashed line passes through \((0,1)\) and \((1,-2)\) (or similar points with slope - 3) and is dashed, and the region below is shaded (since \((0,0)\) is below the line and satisfies the inequality). The top - left graph's dashed line: maybe the slope is different. So the correct graph should be the bottom - left one (the one…

Snap & solve any problem in the app
Get step-by-step solutions on Sovi AI
Photo-based solutions with guided steps
Explore more problems and detailed explanations
The correct graph is the bottom - left graph (the one with the dashed line representing \( y = 1-3x \) and shading below the line).