QUESTION IMAGE
Question
- maximum points: 4
the table below shows the number of siblings each member of a class has
siblings frequency
0 10
1 5
2 3
3 2
find
(a) the median number of siblings 2
(b) the mean number of siblings 2
- maximum points: 6
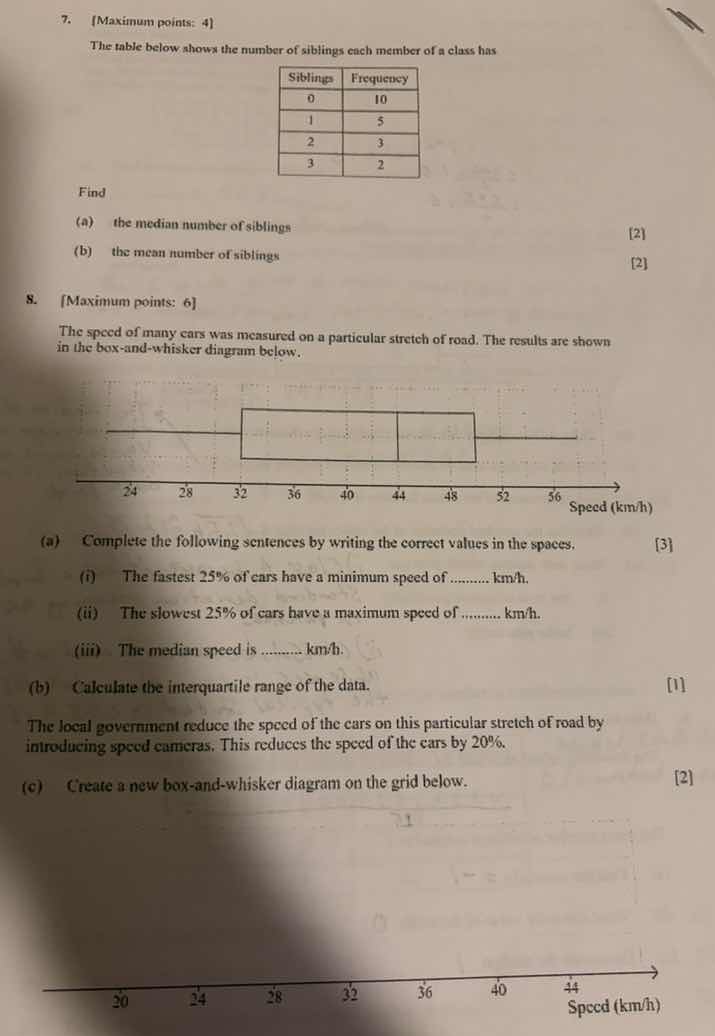
the speed of many cars was measured on a particular stretch of road. the results are shown in the box-and-whisker diagram below.
speed (km/h)
(a) complete the following sentences by writing the correct values in the spaces. 3
(i) the fastest 25% of cars have a minimum speed of ......... km/h.
(ii) the slowest 25% of cars have a maximum speed of ......... km/h.
(iii) the median speed is ......... km/h.
(b) calculate the interquartile range of the data. 1
the local government reduce the speed of the cars on this particular stretch of road by introducing speed cameras. this reduces the speed of the cars by 20%.
(c) create a new box-and-whisker diagram on the grid below. 2
speed (km/h)
Question 7
Step1: Calculate total number of students
Total frequency = $10 + 5 + 3 + 2 = 20$
Step2: Find median position
Median position = $\frac{20 + 1}{2} = 10.5$, so average of 10th and 11th values.
Cumulative frequency for 0 siblings: 10, so 10th value = 0; 11th value = 1.
Median = $\frac{0 + 1}{2} = 0.5$
Step3: Calculate total sibling count
Total = $(0 \times 10) + (1 \times 5) + (2 \times 3) + (3 \times 2) = 0 + 5 + 6 + 6 = 17$
Step4: Compute mean number of siblings
Mean = $\frac{\text{Total sibling count}}{\text{Total students}} = \frac{17}{20} = 0.85$
Part (a)
(i) The fastest 25% of cars correspond to the upper quartile (Q3) of the box plot, which is 48 km/h.
(ii) The slowest 25% of cars correspond to the lower quartile (Q1) of the box plot, which is 32 km/h.
(iii) The median is the middle line of the box, which is 40 km/h.
Part (b)
Step1: Define interquartile range
Interquartile Range (IQR) = Q3 - Q1
Step2: Substitute Q3 and Q1 values
IQR = $48 - 32 = 16$
Part (c)
Step1: Calculate new values (20% reduction)
- New minimum speed: $20 \times 0.8 = 16$ km/h
- New Q1: $32 \times 0.8 = 25.6$ km/h
- New median: $40 \times 0.8 = 32$ km/h
- New Q3: $48 \times 0.8 = 38.4$ km/h
- New maximum speed: $58 \times 0.8 = 46.4$ km/h
Plot these values on the grid: draw a box from 25.6 to 38.4, a vertical line at 32 (median), and whiskers extending to 16 and 46.4.

Snap & solve any problem in the app
Get step-by-step solutions on Sovi AI
Photo-based solutions with guided steps
Explore more problems and detailed explanations
(a) $0.5$
(b) $0.85$
---