QUESTION IMAGE
Question
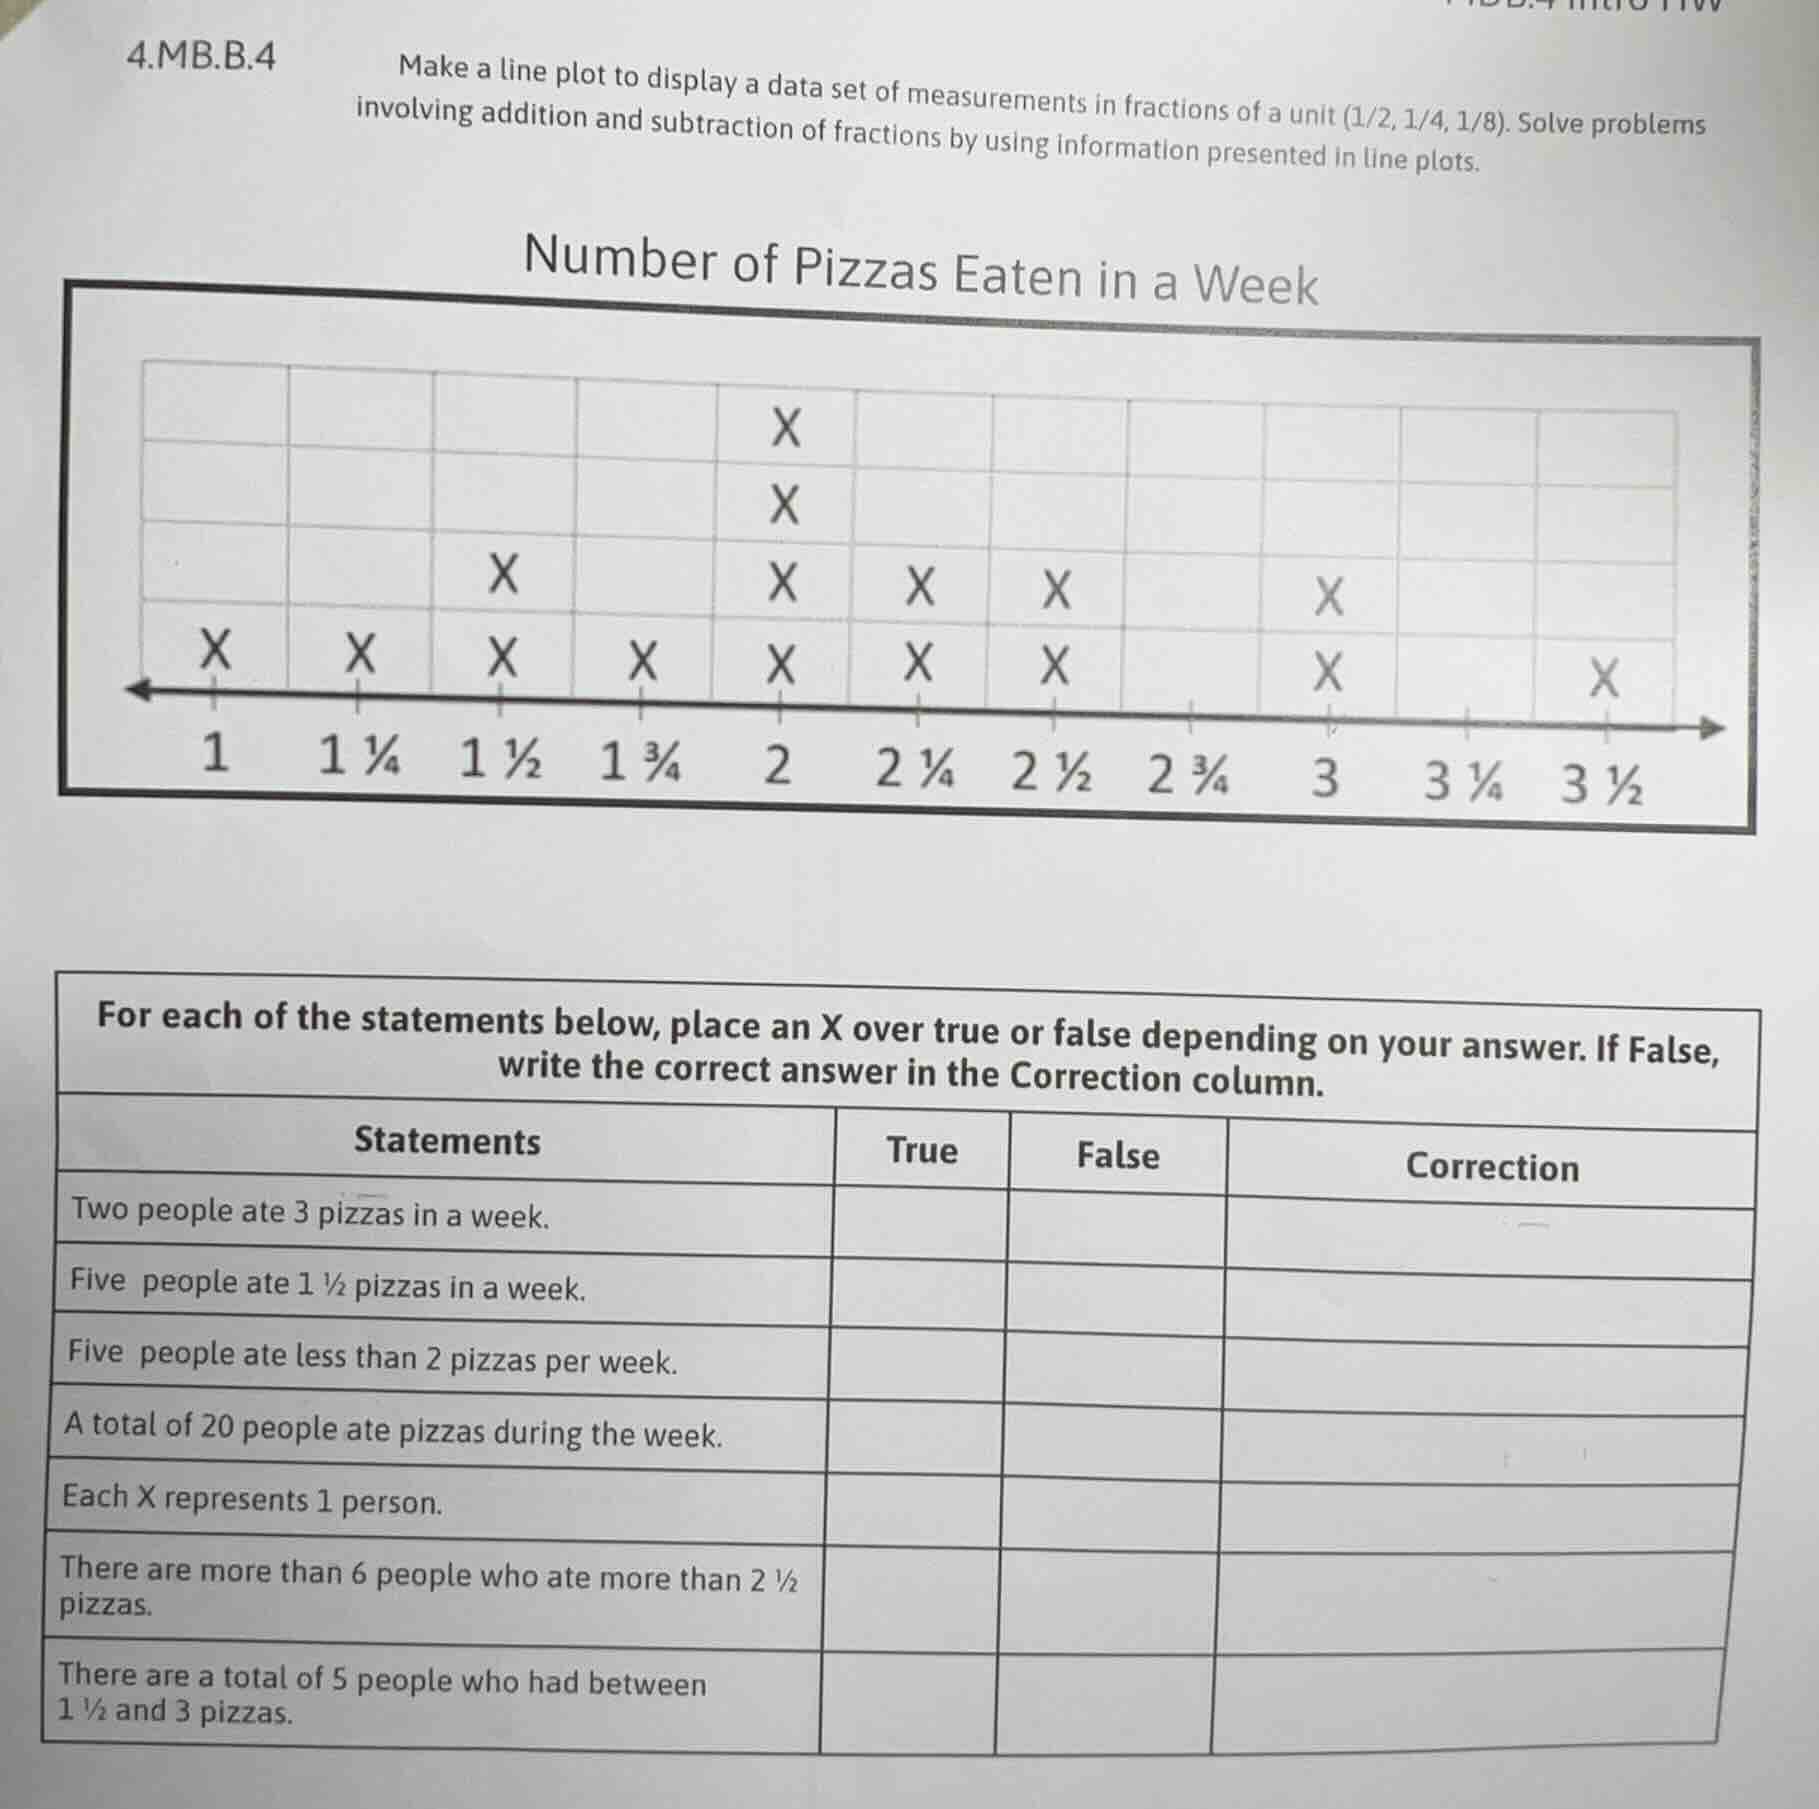
4.mb.b.4 make a line plot to display a data set of measurements in fractions of a unit (1/2, 1/4, 1/8). solve problems involving addition and subtraction of fractions by using information presented in line plots. number of pizzas eaten in a week line plot with xs at 1, 1¼, 1½, 1¾, 2, 2¼, 2½, 3, 3½ for each of the statements below, place an x over true or false depending on your answer. if false, write the correct answer in the correction column. statements true false correction two people ate 3 pizzas in a week. five people ate 1 ½ pizzas in a week. five people ate less than 2 pizzas per week. a total of 20 people ate pizzas during the week. each x represents 1 person. there are more than 6 people who ate more than 2 ½ pizzas. there are a total of 5 people who had between 1 ½ and 3 pizzas.
To solve this, we analyze the line plot by counting the number of X's at each pizza - eating value.
1. Statement: Two people ate 3 pizzas in a week.
- Count the X's at 3: There are 2 X's. So this statement is True.
2. Statement: Five people ate \(1\frac{1}{2}\) pizzas in a week.
- Count the X's at \(1\frac{1}{2}\): There are 2 X's (not 5). So this statement is False. The correction is "Two people ate \(1\frac{1}{2}\) pizzas in a week."
3. Statement: Five people ate less than 2 pizzas per week.
- Values less than 2: 1, \(1\frac{1}{4}\), \(1\frac{1}{2}\), \(1\frac{3}{4}\)
- Count X's at 1: 1
- Count X's at \(1\frac{1}{4}\): 1
- Count X's at \(1\frac{1}{2}\): 2
- Count X's at \(1\frac{3}{4}\): 1
- Total: \(1 + 1+2 + 1=5\). So this statement is True.
4. Statement: A total of 20 people ate pizzas during the week.
- Count all X's:
- At 1: 1
- At \(1\frac{1}{4}\): 1
- At \(1\frac{1}{2}\): 2
- At \(1\frac{3}{4}\): 1
- At 2: 4
- At \(2\frac{1}{4}\): 2
- At \(2\frac{1}{2}\): 2
- At 3: 2
- At \(3\frac{1}{2}\): 1
- Total: \(1+1 + 2+1+4+2+2+2+1 = 16\) (not 20). So this statement is False. The correction is "A total of 16 people ate pizzas during the week."
5. Statement: Each X represents 1 person.
- From the context of the problem (counting people based on X's), each X represents 1 person. So this statement is True.
6. Statement: There are more than 6 people who ate more than \(2\frac{1}{2}\) pizzas.
- Values more than \(2\frac{1}{2}\): \(2\frac{3}{4}\), 3, \(3\frac{1}{4}\), \(3\frac{1}{2}\)
- At \(2\frac{3}{4}\): 0
- At 3: 2
- At \(3\frac{1}{4}\): 0
- At \(3\frac{1}{2}\): 1
- Total: \(2 + 1=3\) (not more than 6). So this statement is False. The correction is "There are 3 people who ate more than \(2\frac{1}{2}\) pizzas."
7. Statement: There are a total of 5 people who had between \(1\frac{1}{2}\) and 3 pizzas.
- Values between \(1\frac{1}{2}\) and 3: \(1\frac{3}{4}\), 2, \(2\frac{1}{4}\), \(2\frac{1}{2}\), 3
- At \(1\frac{3}{4}\): 1
- At 2: 4
- At \(2\frac{1}{4}\): 2
- At \(2\frac{1}{2}\): 2
- At 3: 2
- Total: \(1+4 + 2+2+2=11\) (not 5). So this statement is False. The correction is "There are a total of 11 people who had between \(1\frac{1}{2}\) and 3 pizzas."
Filling the table:
| Statements | True | False | Correction |
|---|---|---|---|
| Five people ate \(1\frac{1}{2}\) pizzas in a week. | X | Two people ate \(1\frac{1}{2}\) pizzas in a week. | |
| Five people ate less than 2 pizzas per week. | X | ||
| A total of 20 people ate pizzas during the week. | X | A total of 16 people ate pizzas during the week. | |
| Each X represents 1 person. | X | ||
| There are more than 6 people who ate more than \(2\frac{1}{2}\) pizzas. | X | There are 3 people who ate more than \(2\frac{1}{2}\) pizzas. | |
| There are a total of 5 people who had between \(1\frac{1}{2}\) and 3 pizzas. | X | There are a total of 11 people who had between \(1\frac{1}{2}\) and 3 pizzas. |

Snap & solve any problem in the app
Get step-by-step solutions on Sovi AI
Photo-based solutions with guided steps
Explore more problems and detailed explanations
To solve this, we analyze the line plot by counting the number of X's at each pizza - eating value.
1. Statement: Two people ate 3 pizzas in a week.
- Count the X's at 3: There are 2 X's. So this statement is True.
2. Statement: Five people ate \(1\frac{1}{2}\) pizzas in a week.
- Count the X's at \(1\frac{1}{2}\): There are 2 X's (not 5). So this statement is False. The correction is "Two people ate \(1\frac{1}{2}\) pizzas in a week."
3. Statement: Five people ate less than 2 pizzas per week.
- Values less than 2: 1, \(1\frac{1}{4}\), \(1\frac{1}{2}\), \(1\frac{3}{4}\)
- Count X's at 1: 1
- Count X's at \(1\frac{1}{4}\): 1
- Count X's at \(1\frac{1}{2}\): 2
- Count X's at \(1\frac{3}{4}\): 1
- Total: \(1 + 1+2 + 1=5\). So this statement is True.
4. Statement: A total of 20 people ate pizzas during the week.
- Count all X's:
- At 1: 1
- At \(1\frac{1}{4}\): 1
- At \(1\frac{1}{2}\): 2
- At \(1\frac{3}{4}\): 1
- At 2: 4
- At \(2\frac{1}{4}\): 2
- At \(2\frac{1}{2}\): 2
- At 3: 2
- At \(3\frac{1}{2}\): 1
- Total: \(1+1 + 2+1+4+2+2+2+1 = 16\) (not 20). So this statement is False. The correction is "A total of 16 people ate pizzas during the week."
5. Statement: Each X represents 1 person.
- From the context of the problem (counting people based on X's), each X represents 1 person. So this statement is True.
6. Statement: There are more than 6 people who ate more than \(2\frac{1}{2}\) pizzas.
- Values more than \(2\frac{1}{2}\): \(2\frac{3}{4}\), 3, \(3\frac{1}{4}\), \(3\frac{1}{2}\)
- At \(2\frac{3}{4}\): 0
- At 3: 2
- At \(3\frac{1}{4}\): 0
- At \(3\frac{1}{2}\): 1
- Total: \(2 + 1=3\) (not more than 6). So this statement is False. The correction is "There are 3 people who ate more than \(2\frac{1}{2}\) pizzas."
7. Statement: There are a total of 5 people who had between \(1\frac{1}{2}\) and 3 pizzas.
- Values between \(1\frac{1}{2}\) and 3: \(1\frac{3}{4}\), 2, \(2\frac{1}{4}\), \(2\frac{1}{2}\), 3
- At \(1\frac{3}{4}\): 1
- At 2: 4
- At \(2\frac{1}{4}\): 2
- At \(2\frac{1}{2}\): 2
- At 3: 2
- Total: \(1+4 + 2+2+2=11\) (not 5). So this statement is False. The correction is "There are a total of 11 people who had between \(1\frac{1}{2}\) and 3 pizzas."
Filling the table:
| Statements | True | False | Correction |
|---|---|---|---|
| Five people ate \(1\frac{1}{2}\) pizzas in a week. | X | Two people ate \(1\frac{1}{2}\) pizzas in a week. | |
| Five people ate less than 2 pizzas per week. | X | ||
| A total of 20 people ate pizzas during the week. | X | A total of 16 people ate pizzas during the week. | |
| Each X represents 1 person. | X | ||
| There are more than 6 people who ate more than \(2\frac{1}{2}\) pizzas. | X | There are 3 people who ate more than \(2\frac{1}{2}\) pizzas. | |
| There are a total of 5 people who had between \(1\frac{1}{2}\) and 3 pizzas. | X | There are a total of 11 people who had between \(1\frac{1}{2}\) and 3 pizzas. |