QUESTION IMAGE
Question
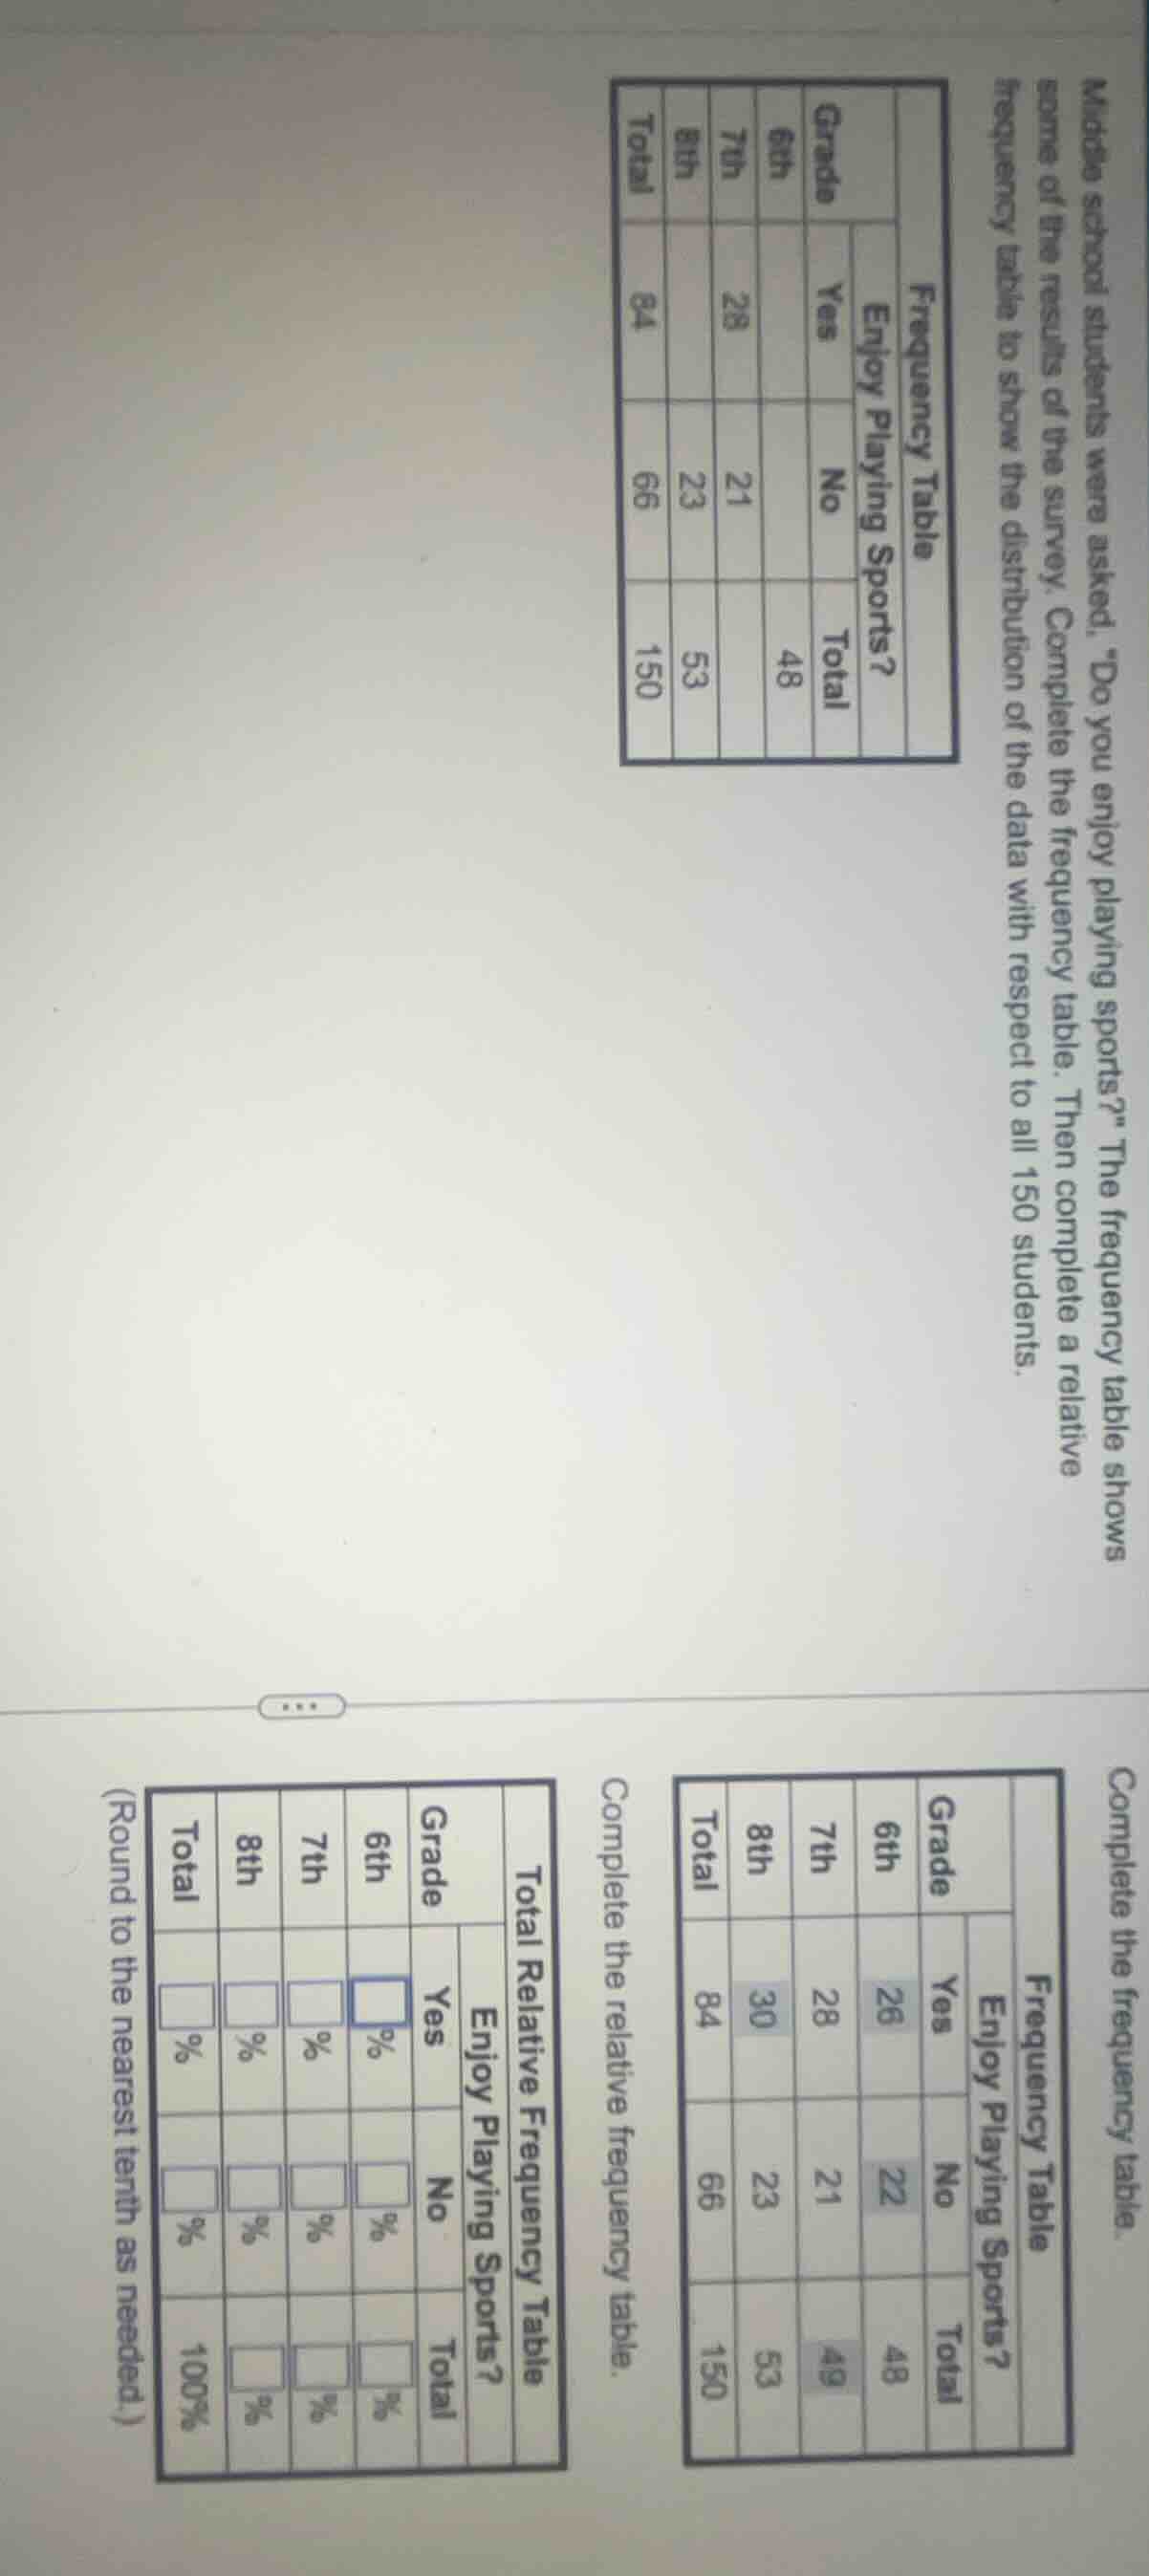
middle school students were asked, \do you enjoy playing sports?\ the frequency table shows some of the results of the survey. complete the frequency table. then complete a relative frequency table to show the distribution of the data with respect to all 150 students.
complete the frequency table.
frequency table
enjoy playing sports?
grade
6th
7th
8th
total
yes
26
28
30
84
no
22
21
23
66
total
48
49
53
150
complete the relative frequency table.
total relative frequency table
enjoy playing sports?
grade
6th
7th
8th
total
yes
□%
□%
□%
□%
no
□%
□%
□%
□%
total
□%
□%
□%
100%
(round to the nearest tenth as needed.)
Part 1: Complete the Frequency Table
To complete the frequency table, we need to find the missing values (6th grade "Yes", 7th grade "Total", 8th grade "Yes", and 8th grade "Total" was already given as 53, but let's verify):
Step 1: 6th Grade - Yes
Total "Yes" is 84. We know 7th grade "Yes" is 28 and 8th grade "Yes" is 30 (from the partially filled table? Wait, no, original frequency table:
Wait, original frequency table (top):
- Yes total: 84
- 7th grade Yes: 28
- 8th grade Yes:?
- 6th grade Yes:?
Wait, the middle frequency table (partially filled) shows 6th Yes:26, 7th Yes:28, 8th Yes:30 (26+28+30=84, correct).
- No total: 66
- 7th grade No:21
- 8th grade No:23
- 6th grade No:?
21 + 23 + 6th No = 66 → 6th No = 66 - 21 -23 = 22 (matches the middle table: 6th No:22).
- Total per grade:
- 6th grade total: Yes (26) + No (22) = 48 (given, correct).
- 7th grade total: Yes (28) + No (21) = 49 (matches middle table: 7th total:49).
- 8th grade total: Yes (30) + No (23) = 53 (given, correct).
Part 2: Complete the Relative Frequency Table
Relative frequency = (Frequency / Total Students) × 100, where Total Students = 150.
Step 1: 6th Grade - Yes
Frequency = 26.
Relative Frequency = (26 / 150) × 100 ≈ 17.3% (rounded to nearest tenth).
Step 2: 6th Grade - No
Frequency = 22.
Relative Frequency = (22 / 150) × 100 ≈ 14.7% (rounded to nearest tenth).
Step 3: 6th Grade - Total
Total frequency for 6th grade = 48.
Relative Frequency = (48 / 150) × 100 = 32.0% (exact, since 48/150 = 0.32).
Step 4: 7th Grade - Yes
Frequency = 28.
Relative Frequency = (28 / 150) × 100 ≈ 18.7% (rounded to nearest tenth).
Step 5: 7th Grade - No
Frequency = 21.
Relative Frequency = (21 / 150) × 100 = 14.0% (exact).
Step 6: 7th Grade - Total
Total frequency for 7th grade = 49.
Relative Frequency = (49 / 150) × 100 ≈ 32.7% (rounded to nearest tenth: 49/150 ≈ 0.32666… → 32.7%).
Step 7: 8th Grade - Yes
Frequency = 30.
Relative Frequency = (30 / 150) × 100 = 20.0% (exact).
Step 8: 8th Grade - No
Frequency = 23.
Relative Frequency = (23 / 150) × 100 ≈ 15.3% (rounded to nearest tenth: 23/150 ≈ 0.15333… → 15.3%).
Step 9: 8th Grade - Total
Total frequency for 8th grade = 53.
Relative Frequency = (53 / 150) × 100 ≈ 35.3% (rounded to nearest tenth: 53/150 ≈ 0.35333… → 35.3%).
Step 10: Total - Yes
Total Yes frequency = 84.
Relative Frequency = (84 / 150) × 100 = 56.0% (exact).
Step 11: Total - No
Total No frequency = 66.
Relative Frequency = (66 / 150) × 100 = 44.0% (exact).
Final Relative Frequency Table (filled):
| Grade | Enjoy Playing Sports? | Relative Frequency (%) |
|---|---|---|
| 6th | No | 14.7 |
| 6th | Total | 32.0 |
| 7th | Yes | 18.7 |
| 7th | No | 14.0 |
| 7th | Total | 32.7 |
| 8th | Yes | 20.0 |
| 8th | No | 15.3 |
| 8th | Total | 35.3 |
| Total | Yes | 56.0 |
| Total | No | 44.0 |
| Total | Total | 100.0 |
(Note: If the question only asks for specific cells, adjust accordingly. For example, the blue box in the image is 6th grade "Yes", which…

Snap & solve any problem in the app
Get step-by-step solutions on Sovi AI
Photo-based solutions with guided steps
Explore more problems and detailed explanations
Part 1: Complete the Frequency Table
To complete the frequency table, we need to find the missing values (6th grade "Yes", 7th grade "Total", 8th grade "Yes", and 8th grade "Total" was already given as 53, but let's verify):
Step 1: 6th Grade - Yes
Total "Yes" is 84. We know 7th grade "Yes" is 28 and 8th grade "Yes" is 30 (from the partially filled table? Wait, no, original frequency table:
Wait, original frequency table (top):
- Yes total: 84
- 7th grade Yes: 28
- 8th grade Yes:?
- 6th grade Yes:?
Wait, the middle frequency table (partially filled) shows 6th Yes:26, 7th Yes:28, 8th Yes:30 (26+28+30=84, correct).
- No total: 66
- 7th grade No:21
- 8th grade No:23
- 6th grade No:?
21 + 23 + 6th No = 66 → 6th No = 66 - 21 -23 = 22 (matches the middle table: 6th No:22).
- Total per grade:
- 6th grade total: Yes (26) + No (22) = 48 (given, correct).
- 7th grade total: Yes (28) + No (21) = 49 (matches middle table: 7th total:49).
- 8th grade total: Yes (30) + No (23) = 53 (given, correct).
Part 2: Complete the Relative Frequency Table
Relative frequency = (Frequency / Total Students) × 100, where Total Students = 150.
Step 1: 6th Grade - Yes
Frequency = 26.
Relative Frequency = (26 / 150) × 100 ≈ 17.3% (rounded to nearest tenth).
Step 2: 6th Grade - No
Frequency = 22.
Relative Frequency = (22 / 150) × 100 ≈ 14.7% (rounded to nearest tenth).
Step 3: 6th Grade - Total
Total frequency for 6th grade = 48.
Relative Frequency = (48 / 150) × 100 = 32.0% (exact, since 48/150 = 0.32).
Step 4: 7th Grade - Yes
Frequency = 28.
Relative Frequency = (28 / 150) × 100 ≈ 18.7% (rounded to nearest tenth).
Step 5: 7th Grade - No
Frequency = 21.
Relative Frequency = (21 / 150) × 100 = 14.0% (exact).
Step 6: 7th Grade - Total
Total frequency for 7th grade = 49.
Relative Frequency = (49 / 150) × 100 ≈ 32.7% (rounded to nearest tenth: 49/150 ≈ 0.32666… → 32.7%).
Step 7: 8th Grade - Yes
Frequency = 30.
Relative Frequency = (30 / 150) × 100 = 20.0% (exact).
Step 8: 8th Grade - No
Frequency = 23.
Relative Frequency = (23 / 150) × 100 ≈ 15.3% (rounded to nearest tenth: 23/150 ≈ 0.15333… → 15.3%).
Step 9: 8th Grade - Total
Total frequency for 8th grade = 53.
Relative Frequency = (53 / 150) × 100 ≈ 35.3% (rounded to nearest tenth: 53/150 ≈ 0.35333… → 35.3%).
Step 10: Total - Yes
Total Yes frequency = 84.
Relative Frequency = (84 / 150) × 100 = 56.0% (exact).
Step 11: Total - No
Total No frequency = 66.
Relative Frequency = (66 / 150) × 100 = 44.0% (exact).
Final Relative Frequency Table (filled):
| Grade | Enjoy Playing Sports? | Relative Frequency (%) |
|---|---|---|
| 6th | No | 14.7 |
| 6th | Total | 32.0 |
| 7th | Yes | 18.7 |
| 7th | No | 14.0 |
| 7th | Total | 32.7 |
| 8th | Yes | 20.0 |
| 8th | No | 15.3 |
| 8th | Total | 35.3 |
| Total | Yes | 56.0 |
| Total | No | 44.0 |
| Total | Total | 100.0 |
(Note: If the question only asks for specific cells, adjust accordingly. For example, the blue box in the image is 6th grade "Yes", which is 17.3%.)