QUESTION IMAGE
Question
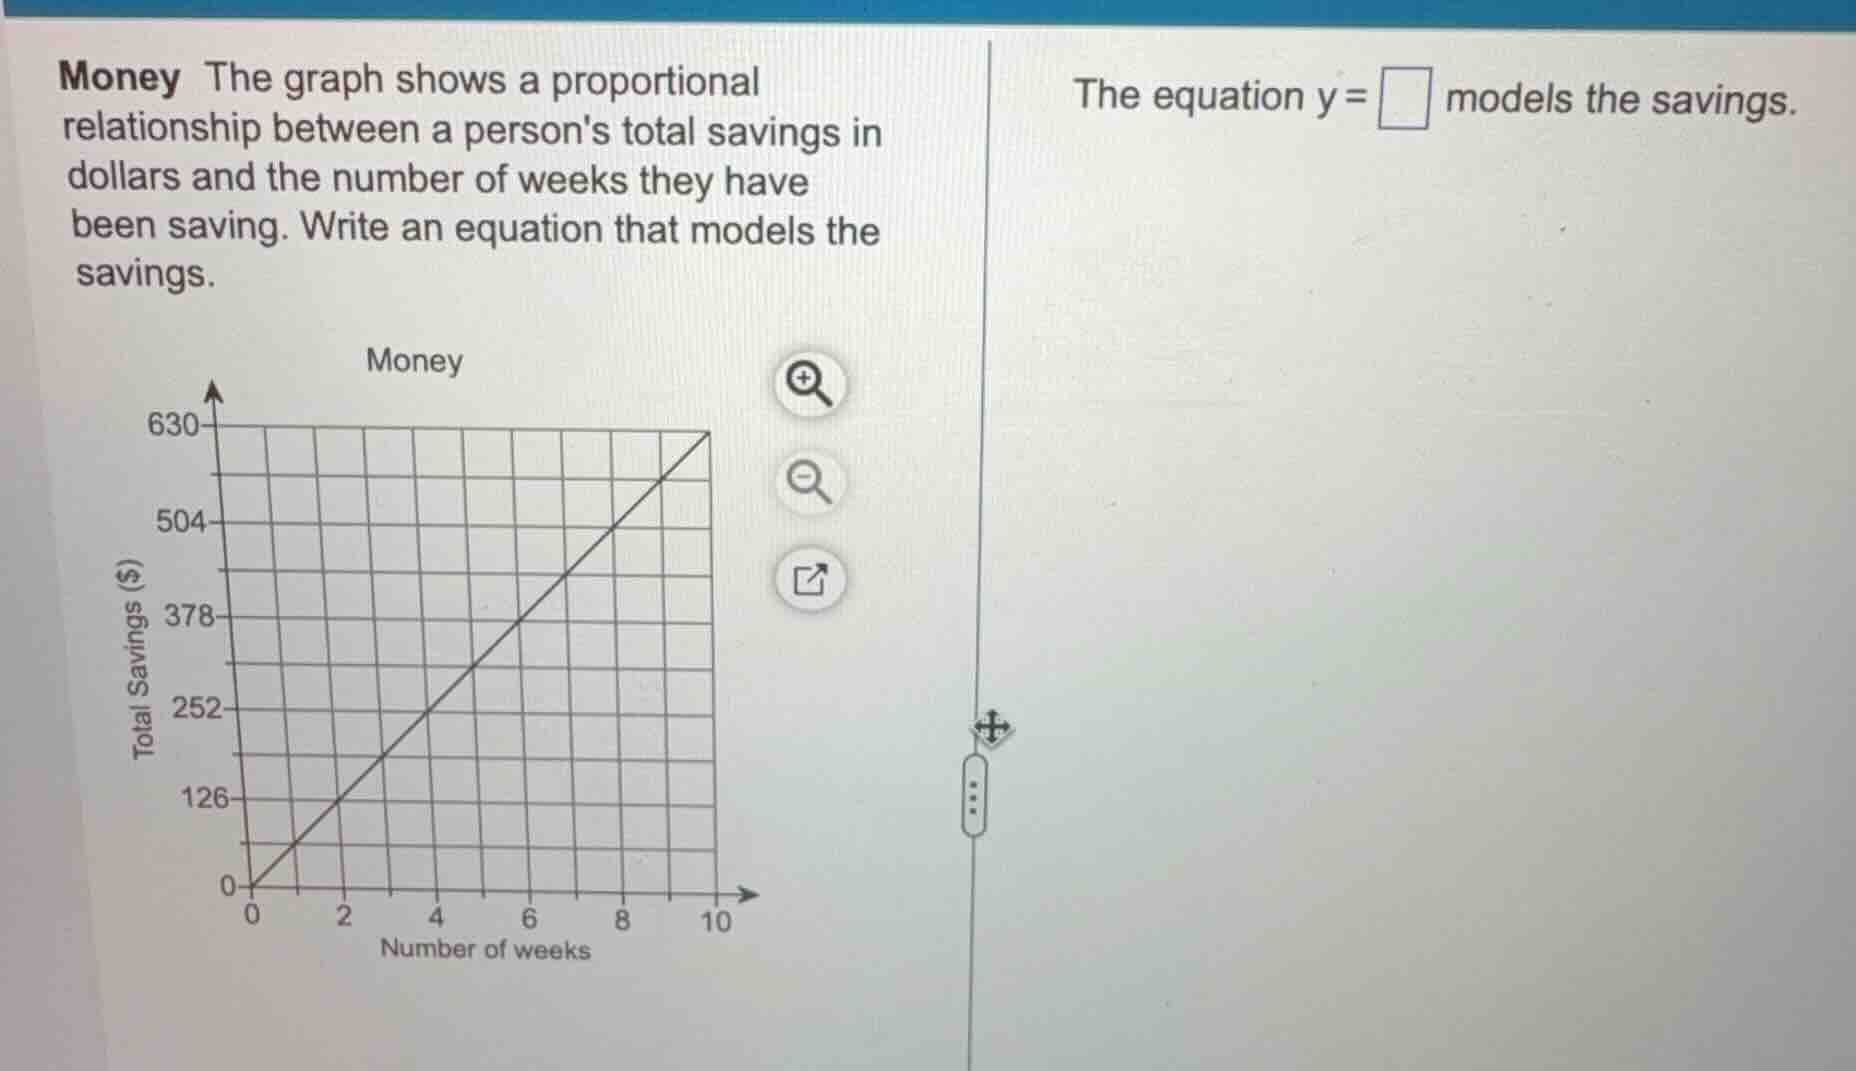
money the graph shows a proportional relationship between a persons total savings in dollars and the number of weeks they have been saving. write an equation that models the savings.
the equation $y=\square$ models the savings.
chart title: money; x-axis: number of weeks, ranging from 0 to 10; y-axis: total savings ($), ranging from 0 to 630; the graph is a straight line passing through the origin and points such as (2,126), (4,252), (6,378), (8,504), (10,630)
Step1: Recall proportional equation form
Proportional relationships follow $y = kx$, where $k$ is the constant of proportionality (weekly savings).
Step2: Calculate $k$ using a point
Use the point $(10, 630)$: $k = \frac{y}{x} = \frac{630}{10} = 63$.
Step3: Write the final equation
Substitute $k=63$ into $y=kx$.

Snap & solve any problem in the app
Get step-by-step solutions on Sovi AI
Photo-based solutions with guided steps
Explore more problems and detailed explanations
$y=63x$