QUESTION IMAGE
Question
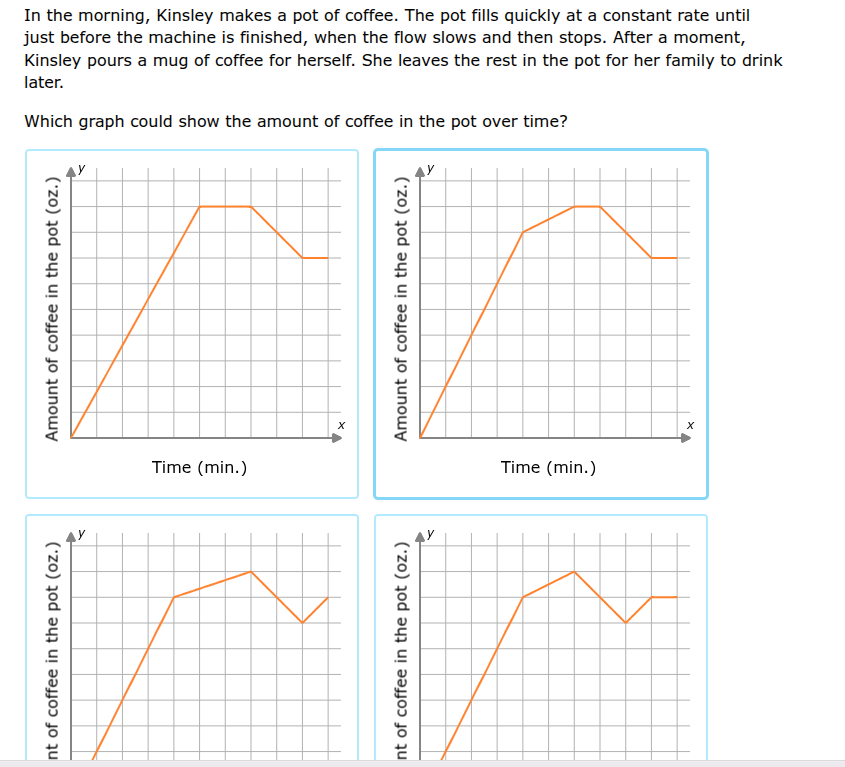
in the morning, kinsley makes a pot of coffee. the pot fills quickly at a constant rate until just before the machine is finished, when the flow slows and then stops. after a moment, kinsley pours a mug of coffee for herself. she leaves the rest in the pot for her family to drink later. which graph could show the amount of coffee in the pot over time?
Step1: Identify first filling phase
The pot fills quickly at a constant rate, so this is a steep, straight upward line on the graph.
Step2: Identify slow filling phase
Just before finishing, the flow slows, so the line becomes less steep (still upward, but gentler slope) until it levels off.
Step3: Identify stationary phase
The flow stops, so the line is horizontal (no change in coffee amount) while Kinsley waits.
Step4: Identify pouring phase
Kinsley pours a mug, so the line drops straight down (constant rate of decrease) to a lower level.
Step5: Identify final stationary phase
The rest stays in the pot, so the line levels off again at the lower amount.
This matches the top-right graph, which has a steep upward slope, a less steep upward slope, a horizontal segment, a downward drop, and a final horizontal segment.

Snap & solve any problem in the app
Get step-by-step solutions on Sovi AI
Photo-based solutions with guided steps
Explore more problems and detailed explanations
The top-right graph (second graph)