QUESTION IMAGE
Question
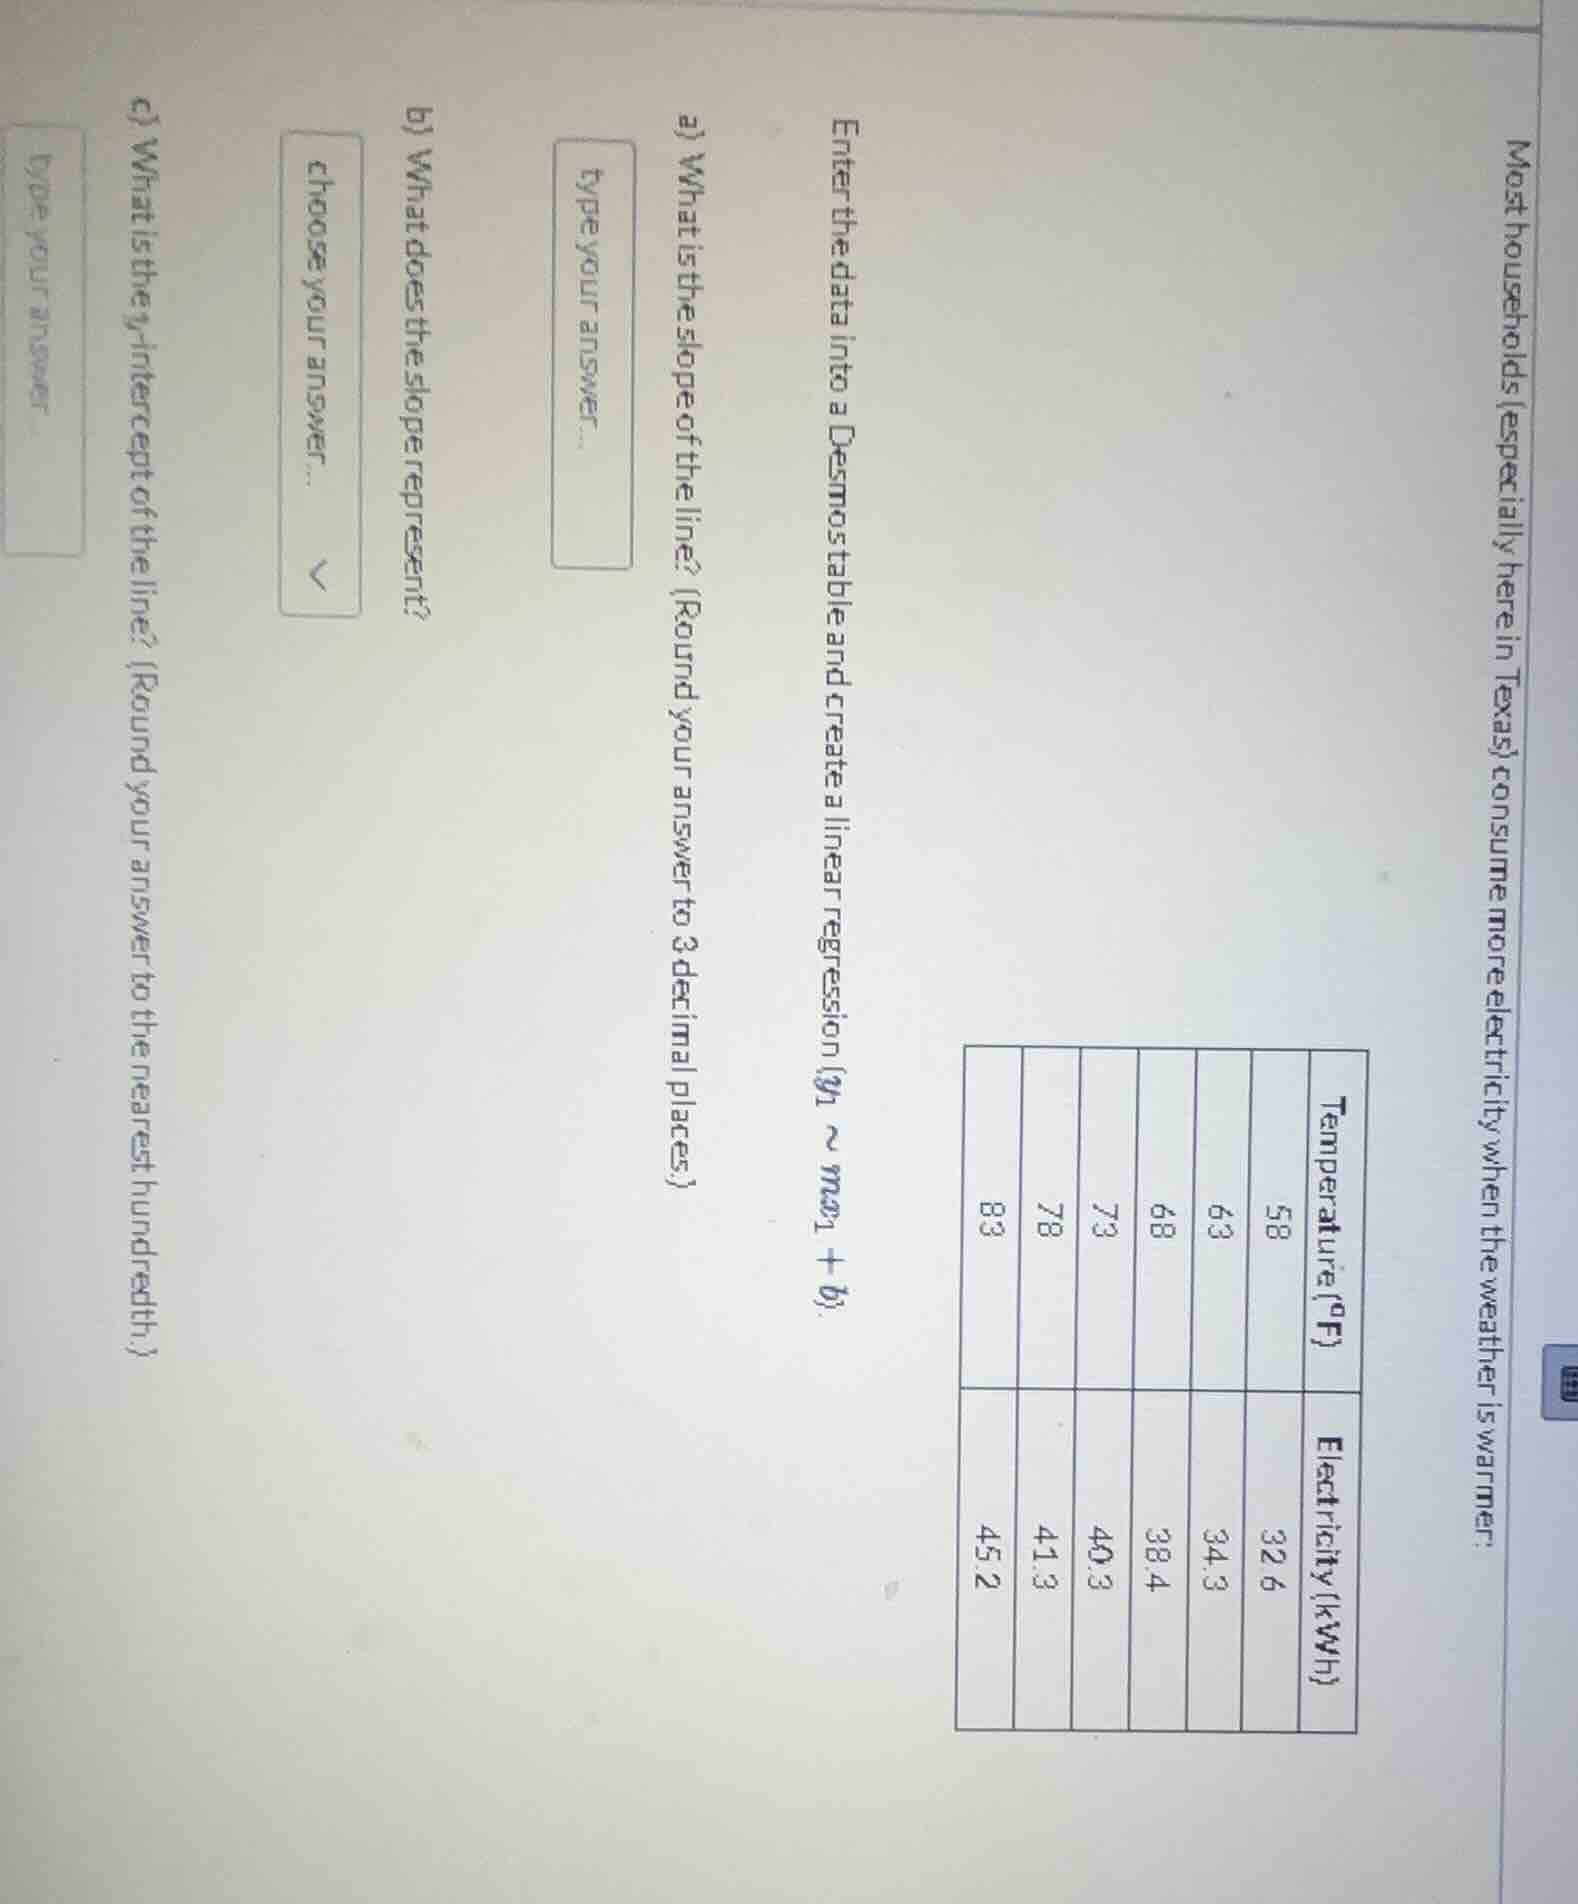
most households (especially here in texas) consume more electricity when the weather is warmer. enter the data into a desmos table and create a linear regression ($y_i \sim mx_i + b$). a) what is the slope of the line? (round your answer to 3 decimal places) type your answer... b) what does the slope represent? choose your answer... c) what is the y - intercept of the line? (round your answer to the nearest hundredth) type your answer... \
Part a)
Step1: Calculate the mean of x (Temperature)
The x values are 58, 63, 68, 73, 78, 83.
The sum of x: \(58 + 63 + 68 + 73 + 78 + 83 = 423\)
The mean of x, \(\bar{x}=\frac{423}{6}=70.5\)
Step2: Calculate the mean of y (Electricity)
The y values are 32.6, 34.3, 38.4, 40.3, 41.3, 45.2.
The sum of y: \(32.6 + 34.3 + 38.4 + 40.3 + 41.3 + 45.2 = 232.1\)
The mean of y, \(\bar{y}=\frac{232.1}{6}\approx38.6833\)
Step3: Calculate the numerator and denominator for slope
For each data point, calculate \((x_i - \bar{x})(y_i - \bar{y})\) and \((x_i - \bar{x})^2\)
- For \(x = 58, y = 32.6\):
\((58 - 70.5)(32.6 - 38.6833)=(-12.5)(-6.0833)=76.04125\)
\((58 - 70.5)^2=(-12.5)^2 = 156.25\)
- For \(x = 63, y = 34.3\):
\((63 - 70.5)(34.3 - 38.6833)=(-7.5)(-4.3833)=32.87475\)
\((63 - 70.5)^2=(-7.5)^2 = 56.25\)
- For \(x = 68, y = 38.4\):
\((68 - 70.5)(38.4 - 38.6833)=(-2.5)(-0.2833)=0.70825\)
\((68 - 70.5)^2=(-2.5)^2 = 6.25\)
- For \(x = 73, y = 40.3\):
\((73 - 70.5)(40.3 - 38.6833)=(2.5)(1.6167)=4.04175\)
\((73 - 70.5)^2=(2.5)^2 = 6.25\)
- For \(x = 78, y = 41.3\):
\((78 - 70.5)(41.3 - 38.6833)=(7.5)(2.6167)=19.62525\)
\((78 - 70.5)^2=(7.5)^2 = 56.25\)
- For \(x = 83, y = 45.2\):
\((83 - 70.5)(45.2 - 38.6833)=(12.5)(6.5167)=81.45875\)
\((83 - 70.5)^2=(12.5)^2 = 156.25\)
Sum of \((x_i - \bar{x})(y_i - \bar{y})\): \(76.04125+32.87475 + 0.70825+4.04175+19.62525+81.45875 = 214.75\)
Sum of \((x_i - \bar{x})^2\): \(156.25 + 56.25+6.25+6.25+56.25+156.25 = 437.5\)
Step4: Calculate the slope (m)
The slope \(m=\frac{\sum(x_i - \bar{x})(y_i - \bar{y})}{\sum(x_i - \bar{x})^2}=\frac{214.75}{437.5}\approx0.491\) (rounded to 3 decimal places)
The slope in a linear regression model \(y = mx + b\) (where \(y\) is electricity consumption in kWh and \(x\) is temperature in °F) represents the change in the dependent variable (electricity consumption) for a one - unit change in the independent variable (temperature). In this context, the slope of approximately 0.491 means that for each 1°F increase in temperature, the electricity consumption of households is expected to increase by approximately 0.491 kWh.
Step1: Use the formula for the y - intercept (b)
The formula for the y - intercept in a linear regression is \(b=\bar{y}-m\bar{x}\)
We know that \(\bar{y}\approx38.6833\), \(m\approx0.491\), and \(\bar{x}=70.5\)
Step2: Calculate the y - intercept
\(b = 38.6833-0.491\times70.5\)
\(0.491\times70.5 = 0.491\times(70 + 0.5)=0.491\times70+0.491\times0.5 = 34.37+0.2455 = 34.6155\)
\(b=38.6833 - 34.6155 = 4.0678\approx4.07\) (rounded to the nearest hundredth)

Snap & solve any problem in the app
Get step-by-step solutions on Sovi AI
Photo-based solutions with guided steps
Explore more problems and detailed explanations
0.491