QUESTION IMAGE
Question
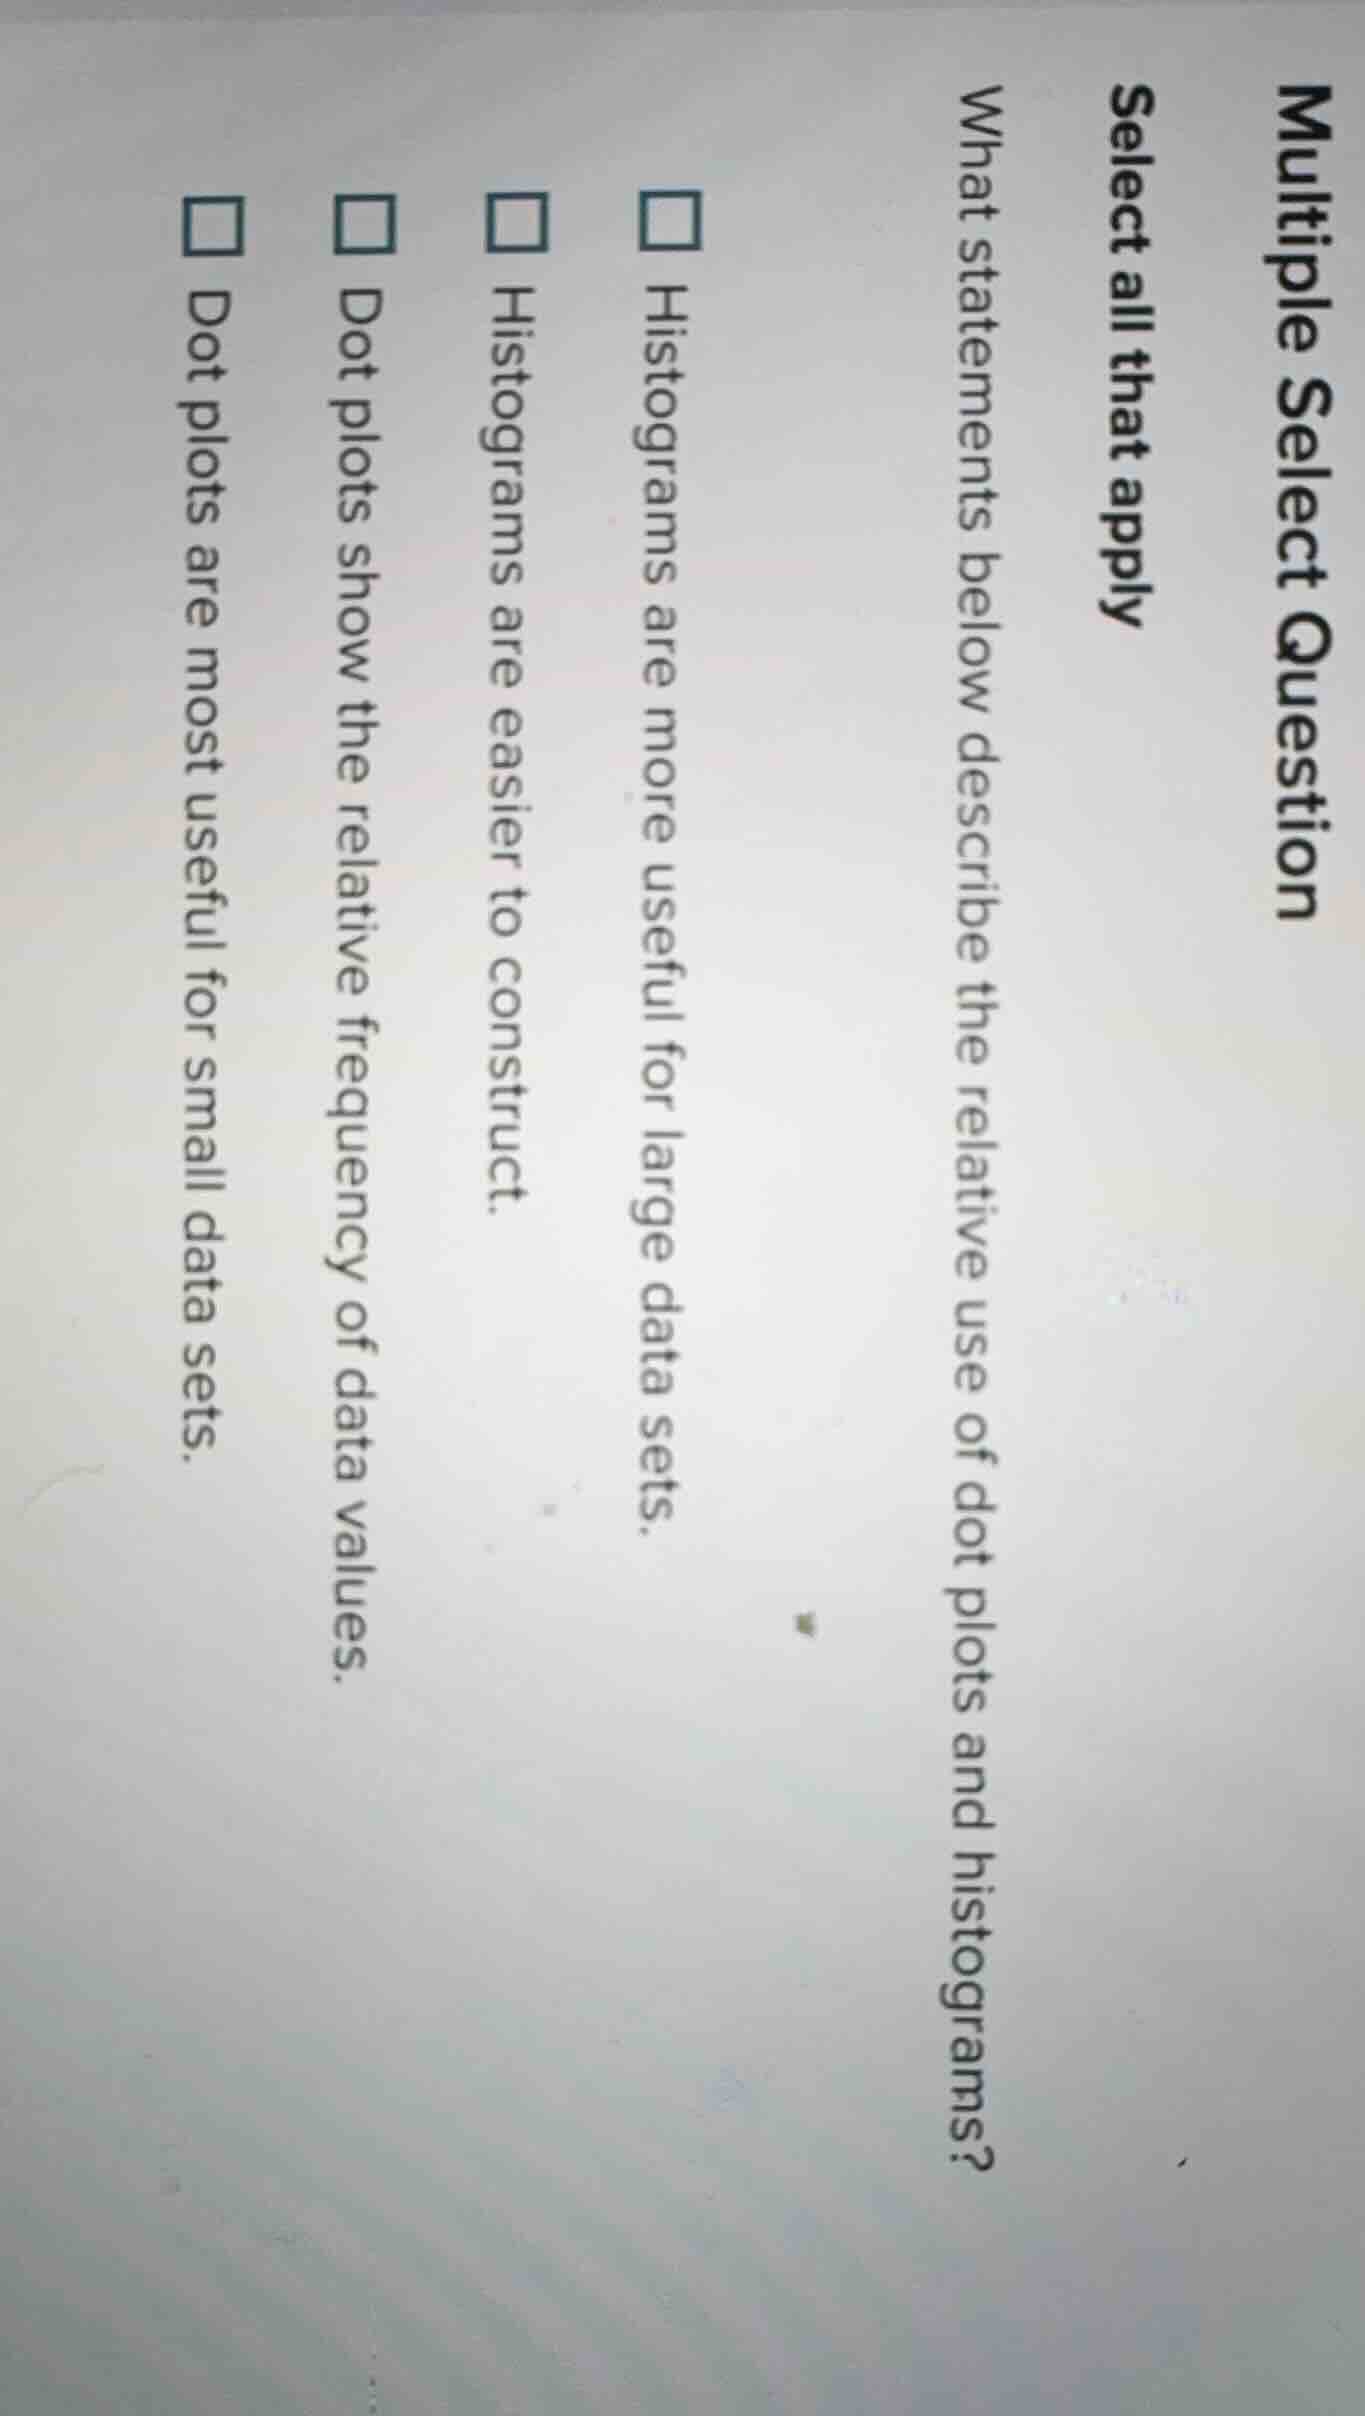
multiple select question
select all that apply
what statements below describe the relative use of dot plots and histograms?
□ histograms are more useful for large data sets.
□ histograms are easier to construct.
□ dot plots show the relative frequency of data values.
□ dot plots are most useful for small data sets.
Brief Explanations
- For "Histograms are more useful for large data sets": Histograms group data into intervals, making them efficient for summarizing large amounts of data.
- For "Dot plots are most useful for small data sets": Dot plots show individual data points, so they are clearer and more manageable with small data.
- For "Dot plots show the relative frequency of data values": Each dot in a dot plot represents a data point, and the number of dots (or their arrangement) can show how often values occur, indicating relative frequency.
- "Histograms are easier to construct" is incorrect because dot plots are generally simpler to construct as they just plot individual data points, while histograms require binning data into intervals, which can be more complex.

Snap & solve any problem in the app
Get step-by-step solutions on Sovi AI
Photo-based solutions with guided steps
Explore more problems and detailed explanations
A. Histograms are more useful for large data sets
B. Dot plots show the relative frequency of data values
C. Dot plots are most useful for small data sets