QUESTION IMAGE
Question
multiple select question
select all that apply
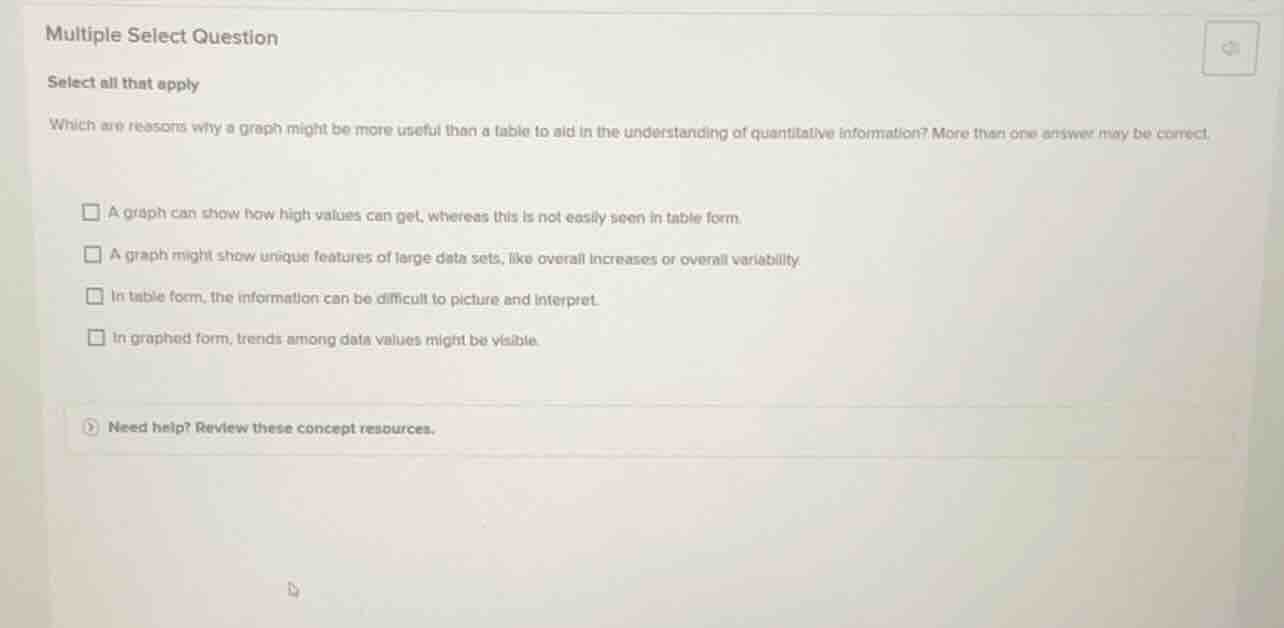
which are reasons why a graph might be more useful than a table to aid in the understanding of quantitative information? more than one answer may be correct.
a graph can show how high values can get, whereas this is not easily seen in table form.
a graph might show unique features of large data sets, like overall increases or overall variability
in table form, the information can be difficult to picture and interpret.
in graphed form, trends among data values might be visible.
need help? review these concept resources.
- Option A: Graphs can visually represent the range of values (like maximums) more clearly than tables, where scanning numbers to find the highest value is harder.
- Option B: For large datasets, graphs (e.g., line graphs, scatter plots) can reveal patterns like upward trends or variability that are obscured in a table of raw numbers.
- Option C: Tables present data as rows/columns of numbers, which can be hard to visualize as a whole. Graphs (e.g., bar graphs, pie charts) simplify visualization.
- Option D: Graphs (e.g., time - series graphs) make trends (like increasing/decreasing over time) visible, while tables require manual analysis of numbers to spot trends.

Snap & solve any problem in the app
Get step-by-step solutions on Sovi AI
Photo-based solutions with guided steps
Explore more problems and detailed explanations
A. A graph can show how high values can get, whereas this is not easily seen in table form.
B. A graph might show unique features of large data sets, like overall increases or overall variability
C. In table form, the information can be difficult to picture and interpret.
D. In graphed form, trends among data values might be visible.