QUESTION IMAGE
Question
name
date
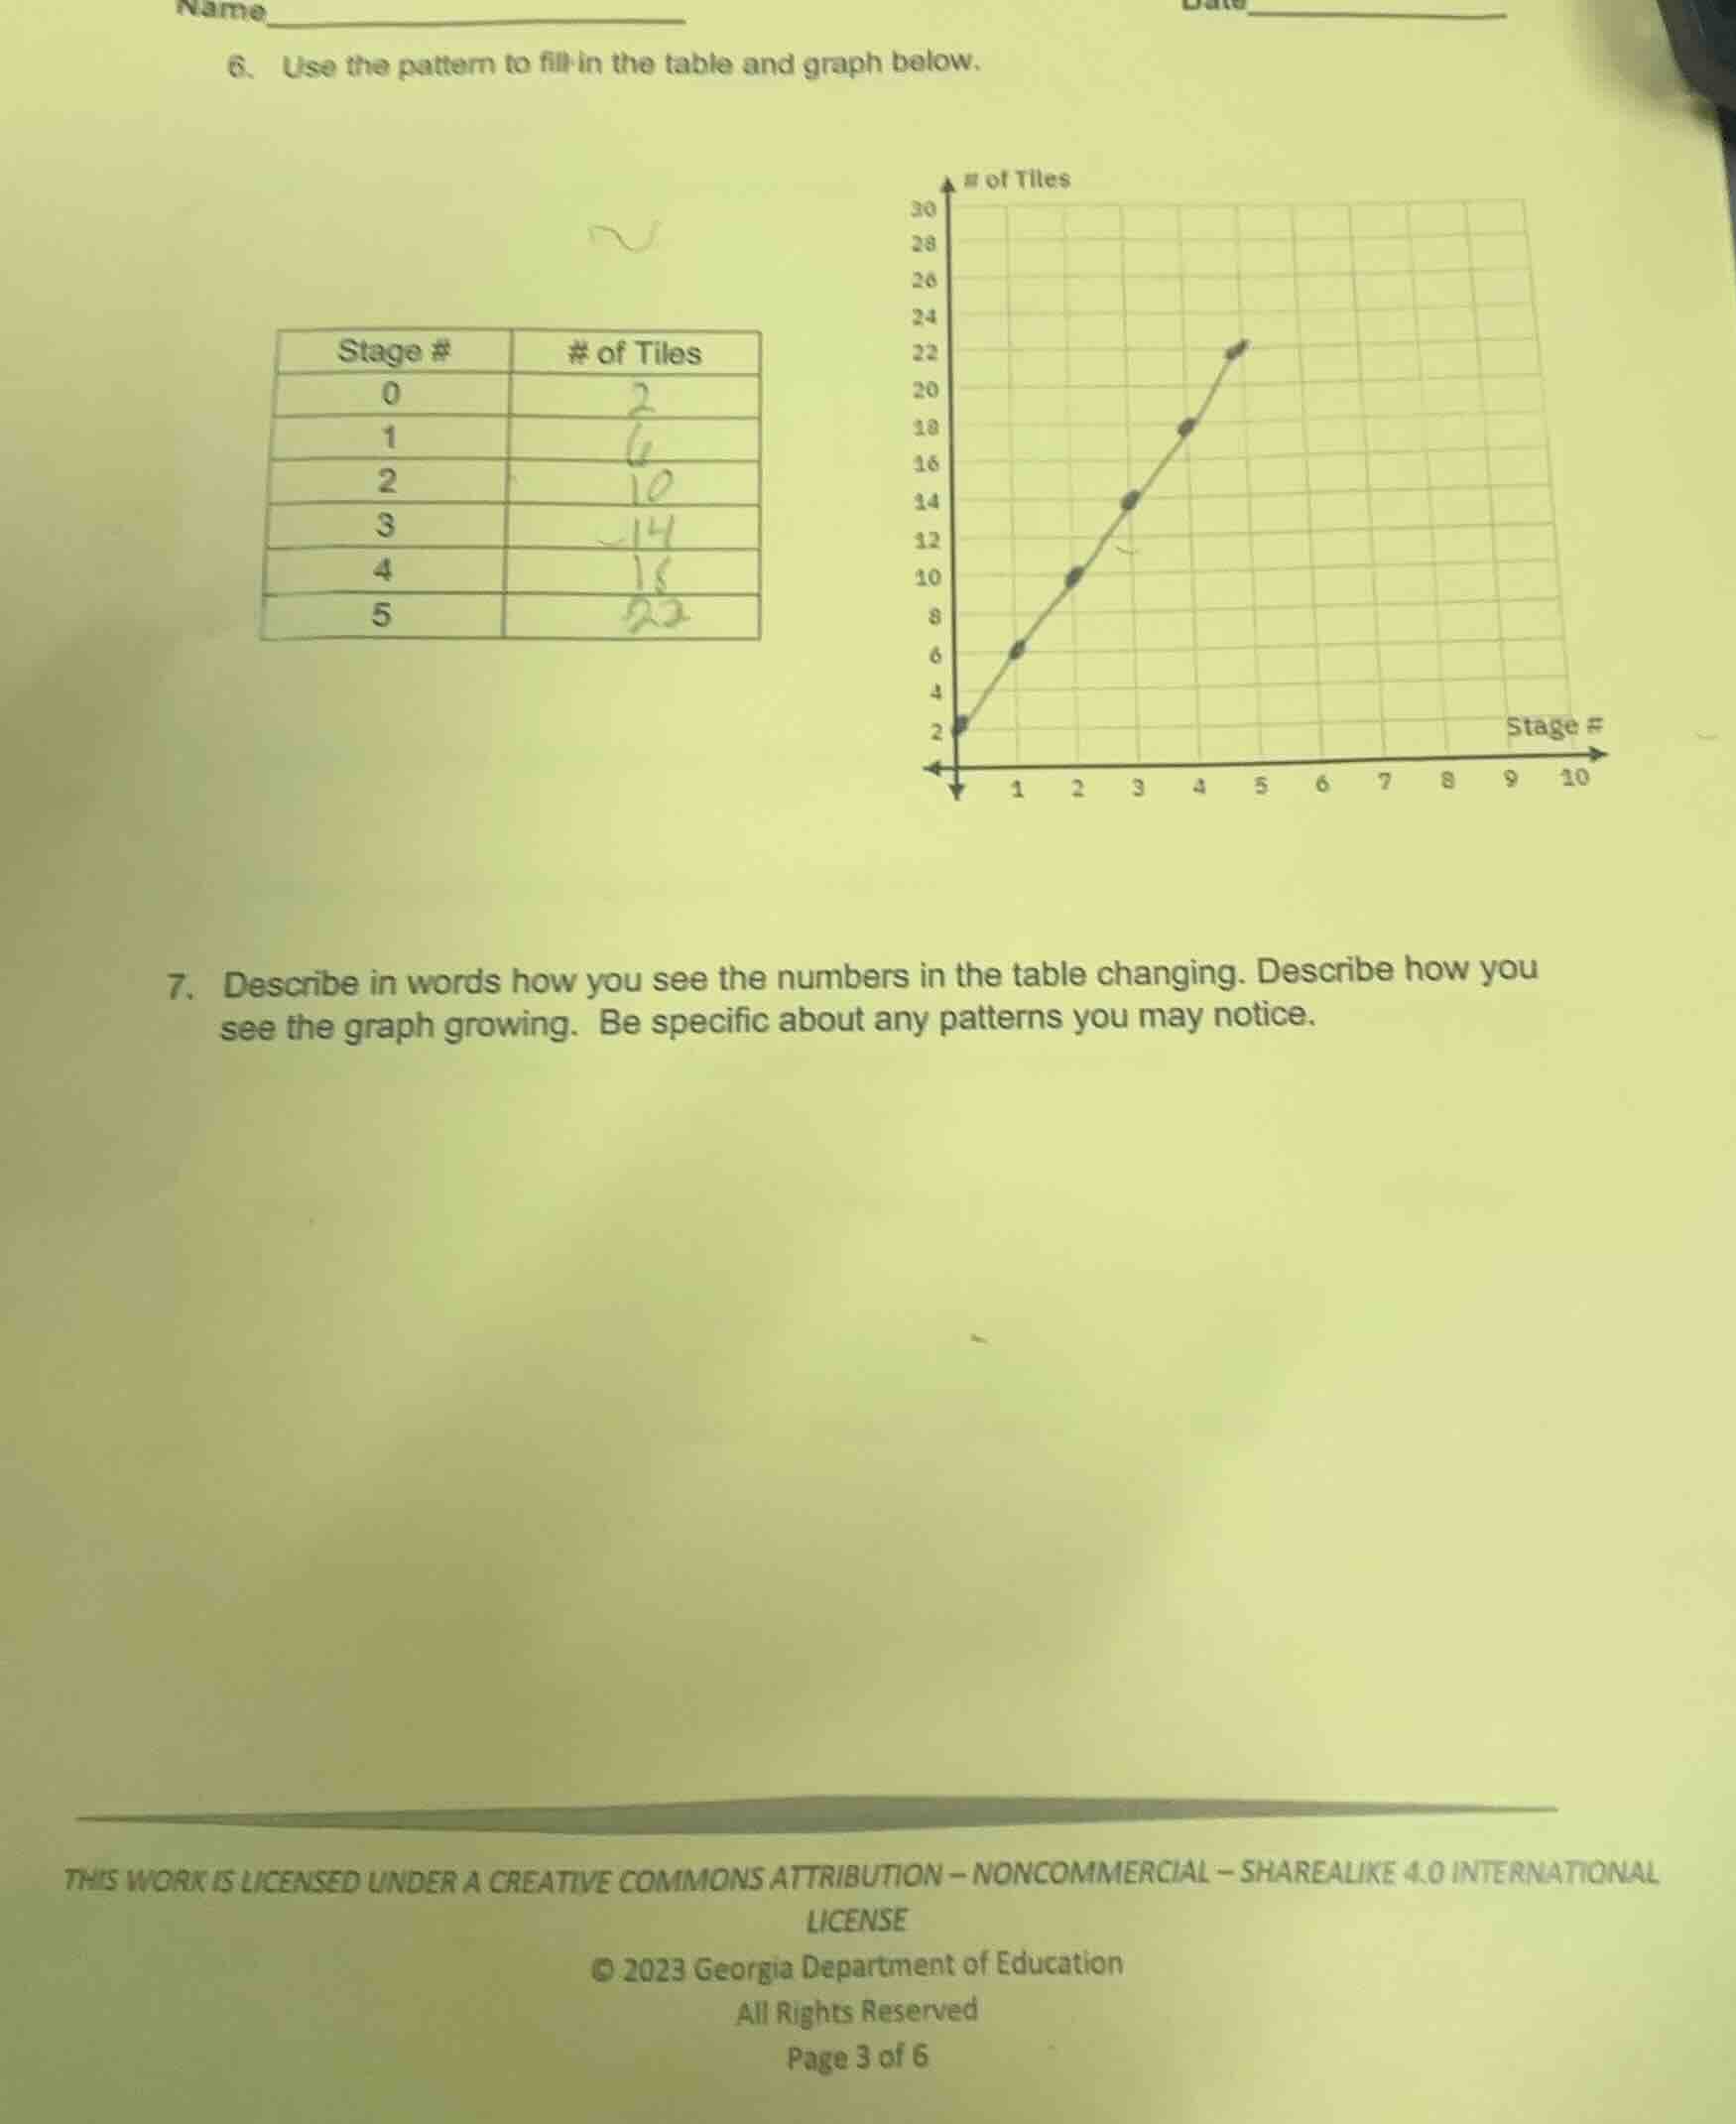
- use the pattern to fill in the table and graph below.
stage # | # of tiles
0 | 2
1 | 6
2 | 10
3 | 14
4 | 18
5 | 22
of tiles
stage #
- describe in words how you see the numbers in the table changing. describe how you see the graph growing. be specific about any patterns you may notice.
this work is licensed under a creative commons attribution - noncommercial - sharealike 4.0 international license
© 2023 georgia department of education
all rights reserved
page 3 of 6
For the table: Starting from 2 tiles at Stage 0, the number of tiles increases by 4 each time the stage number goes up by 1.
For the graph: The plotted points form a straight, upward-sloping line. As the stage number (x-axis) increases by 1, the number of tiles (y-axis) increases by a consistent 4, showing a constant, linear growth pattern.

Snap & solve any problem in the app
Get step-by-step solutions on Sovi AI
Photo-based solutions with guided steps
Explore more problems and detailed explanations
Table pattern: Each stage adds 4 tiles, starting at 2.
Graph pattern: Linear upward growth; each 1-stage increase raises tile count by 4, forming a straight line.