QUESTION IMAGE
Question
name:
grade math ia 1, l088 (proportional relationships)
constant of proportionality graphs
homework
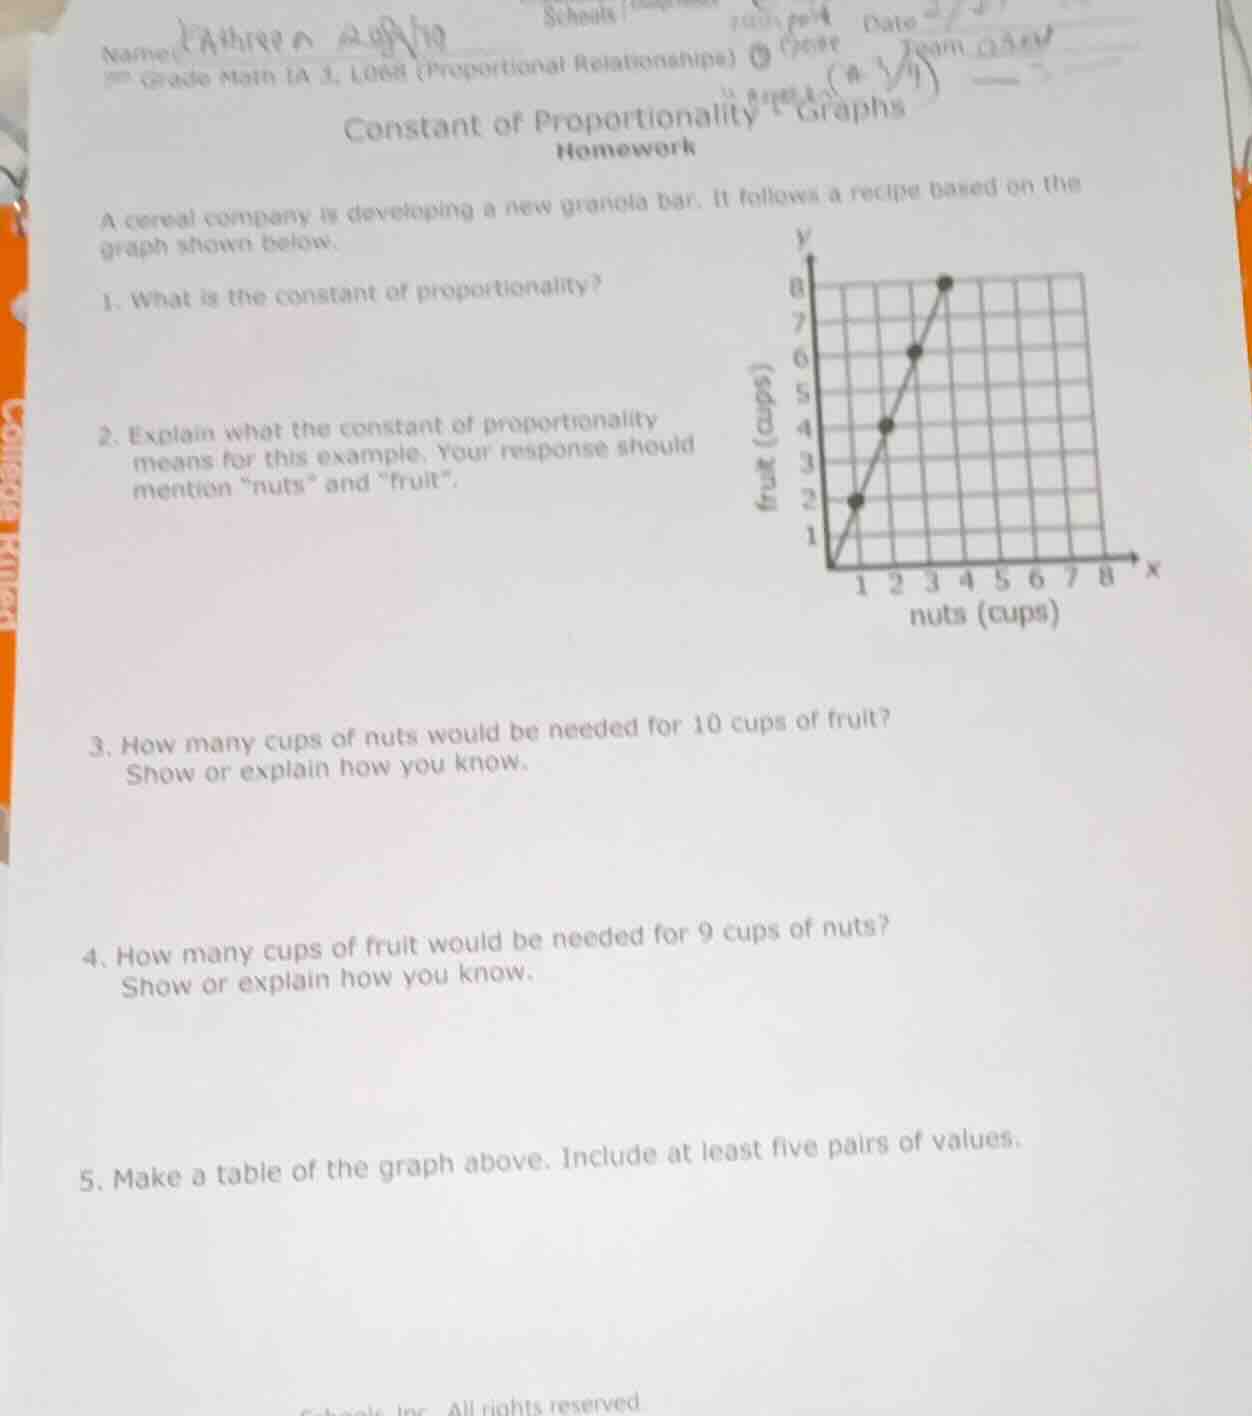
a cereal company is developing a new granola bar. it follows a recipe based on the graph shown below.
- what is the constant of proportionality?
- explain what the constant of proportionality means for this example. your response should mention
uts\ and \fruit\.
- how many cups of nuts would be needed for 10 cups of fruit? show or explain how you know.
- how many cups of fruit would be needed for 9 cups of nuts? show or explain how you know.
- make a table of the graph above. include at least five pairs of values.
(graph: x - axis labeled nuts (cups), y - axis labeled fruit (cups), with points plotted at (1,2), (2,4), (3,6), (4,8))
Step1: Define proportional relationship
For a proportional relationship $y = kx$, $k = \frac{y}{x}$, where $y$ = fruit (cups), $x$ = nuts (cups).
Step2: Calculate k using a point
Use point $(1,2)$:
$k = \frac{2}{1} = 2$
Step3: Explain the constant's meaning
The constant $k=2$ means for every 1 cup of nuts, 2 cups of fruit are used in the granola bar recipe.
Step4: Solve for nuts with 10 fruit
Rearrange $y=kx$ to $x=\frac{y}{k}$. Substitute $y=10$, $k=2$:
$x = \frac{10}{2} = 5$
Step5: Solve for fruit with 9 nuts
Use $y=kx$. Substitute $x=9$, $k=2$:
$y = 2 \times 9 = 18$
Step6: Create value table
Extract points from the graph and add pairs:
| Nuts (cups) | Fruit (cups) |
|---|---|
| 1 | 2 |
| 2 | 4 |
| 3 | 6 |
| 4 | 8 |
| 5 | 10 |

Snap & solve any problem in the app
Get step-by-step solutions on Sovi AI
Photo-based solutions with guided steps
Explore more problems and detailed explanations
- 2
- For every 1 cup of nuts, the recipe uses 2 cups of fruit.
- 5 cups of nuts
- 18 cups of fruit
5.
| Nuts (cups) | Fruit (cups) |
|---|---|
| 1 | 2 |
| 2 | 4 |
| 3 | 6 |
| 4 | 8 |
| 5 | 10 |