QUESTION IMAGE
Question
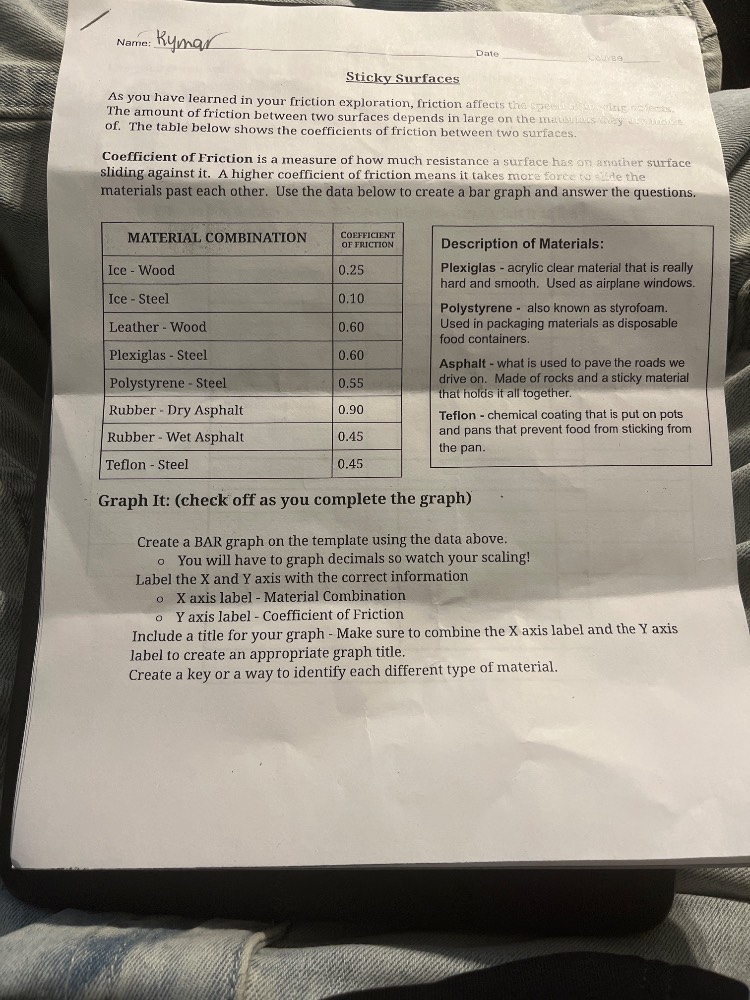
name: kumardatesticky surfacesas you have learned in your friction exploration, friction affects the speedthe amount of friction between two surfaces depends in large on the materia of. the table below shows the coefficients of friction between two surfaces.coefficient of friction is a measure of how much resistance a surface has on another surface sliding against it. a higher coefficient of friction means it takes more force to slide the materials past each other. use the data below to create a bar graph and answer the questions.material combination | coefficient of frictionice - wood | 0.25ice - steel | 0.10leather - wood | 0.60plexiglas - steel | 0.60polystyrene - steel | 0.55rubber - dry asphalt | 0.90rubber - wet asphalt | 0.45teflon - steel | 0.45description of materials:plexiglas - acrylic clear material that is really hard and smooth. used as airplane windows.polystyrene - also known as styrofoam. used in packaging materials as disposable food containers.asphalt - what is used to pave the roads we drive on. made of rocks and a sticky material that holds it all together.teflon - chemical coating that is put on pots and pans that prevent food from sticking from the pan.graph it: (check off as you complete the graph)create a bar graph on the template using the data above.○ you will have to graph decimals so watch your scaling!label the x and y axis with the correct information○ x axis label - material combination○ y axis label - coefficient of frictioninclude a title for your graph - make sure to combine the x axis label and the y axis label to create an appropriate graph title.create a key or a way to identify each different type of material.
- Graph Title: Combine the X and Y axis labels to make a descriptive title, e.g., "Coefficient of Friction for Different Material Combinations"
- Axis Setup:
- Label the horizontal X-axis "Material Combination" and list all 8 pairs (Ice-Wood, Ice-Steel, ..., Teflon-Steel) evenly spaced.
- Label the vertical Y-axis "Coefficient of Friction" and set a scale that includes 0 to 1.0 (e.g., mark 0, 0.1, 0.2, ..., 1.0) to fit all decimal values.
- Bar Construction: For each material combination, draw a vertical bar whose height matches the corresponding coefficient of friction value from the table.
- Key/Legend: Create a key that matches each material (Ice, Wood, Steel, Leather, Plexiglas, Polystyrene, Rubber, Asphalt, Teflon) to a unique color or pattern, then apply that color/pattern to the bars (e.g., color the Ice-Wood bar with one color for Ice and another for Wood, or use a pattern that represents both).

Snap & solve any problem in the app
Get step-by-step solutions on Sovi AI
Photo-based solutions with guided steps
Explore more problems and detailed explanations
- Graph Title: Coefficient of Friction for Different Material Combinations
- X-axis: Labeled "Material Combination", with categories: Ice-Wood, Ice-Steel, Leather-Wood, Plexiglas-Steel, Polystyrene-Steel, Rubber-Dry Asphalt, Rubber-Wet Asphalt, Teflon-Steel
- Y-axis: Labeled "Coefficient of Friction", with a linear scale from 0 to 1.0
- Bar Heights (matching table values):
- Ice-Wood: 0.25
- Ice-Steel: 0.10
- Leather-Wood: 0.60
- Plexiglas-Steel: 0.60
- Polystyrene-Steel: 0.55
- Rubber-Dry Asphalt: 0.90
- Rubber-Wet Asphalt: 0.45
- Teflon-Steel: 0.45
- Key: A legend identifying each unique material (Ice, Wood, Steel, Leather, Plexiglas, Polystyrene, Rubber, Asphalt, Teflon) with a distinct color/pattern for bar coding.