QUESTION IMAGE
Question
name: paillon
class: bio
date: 1/6/2024
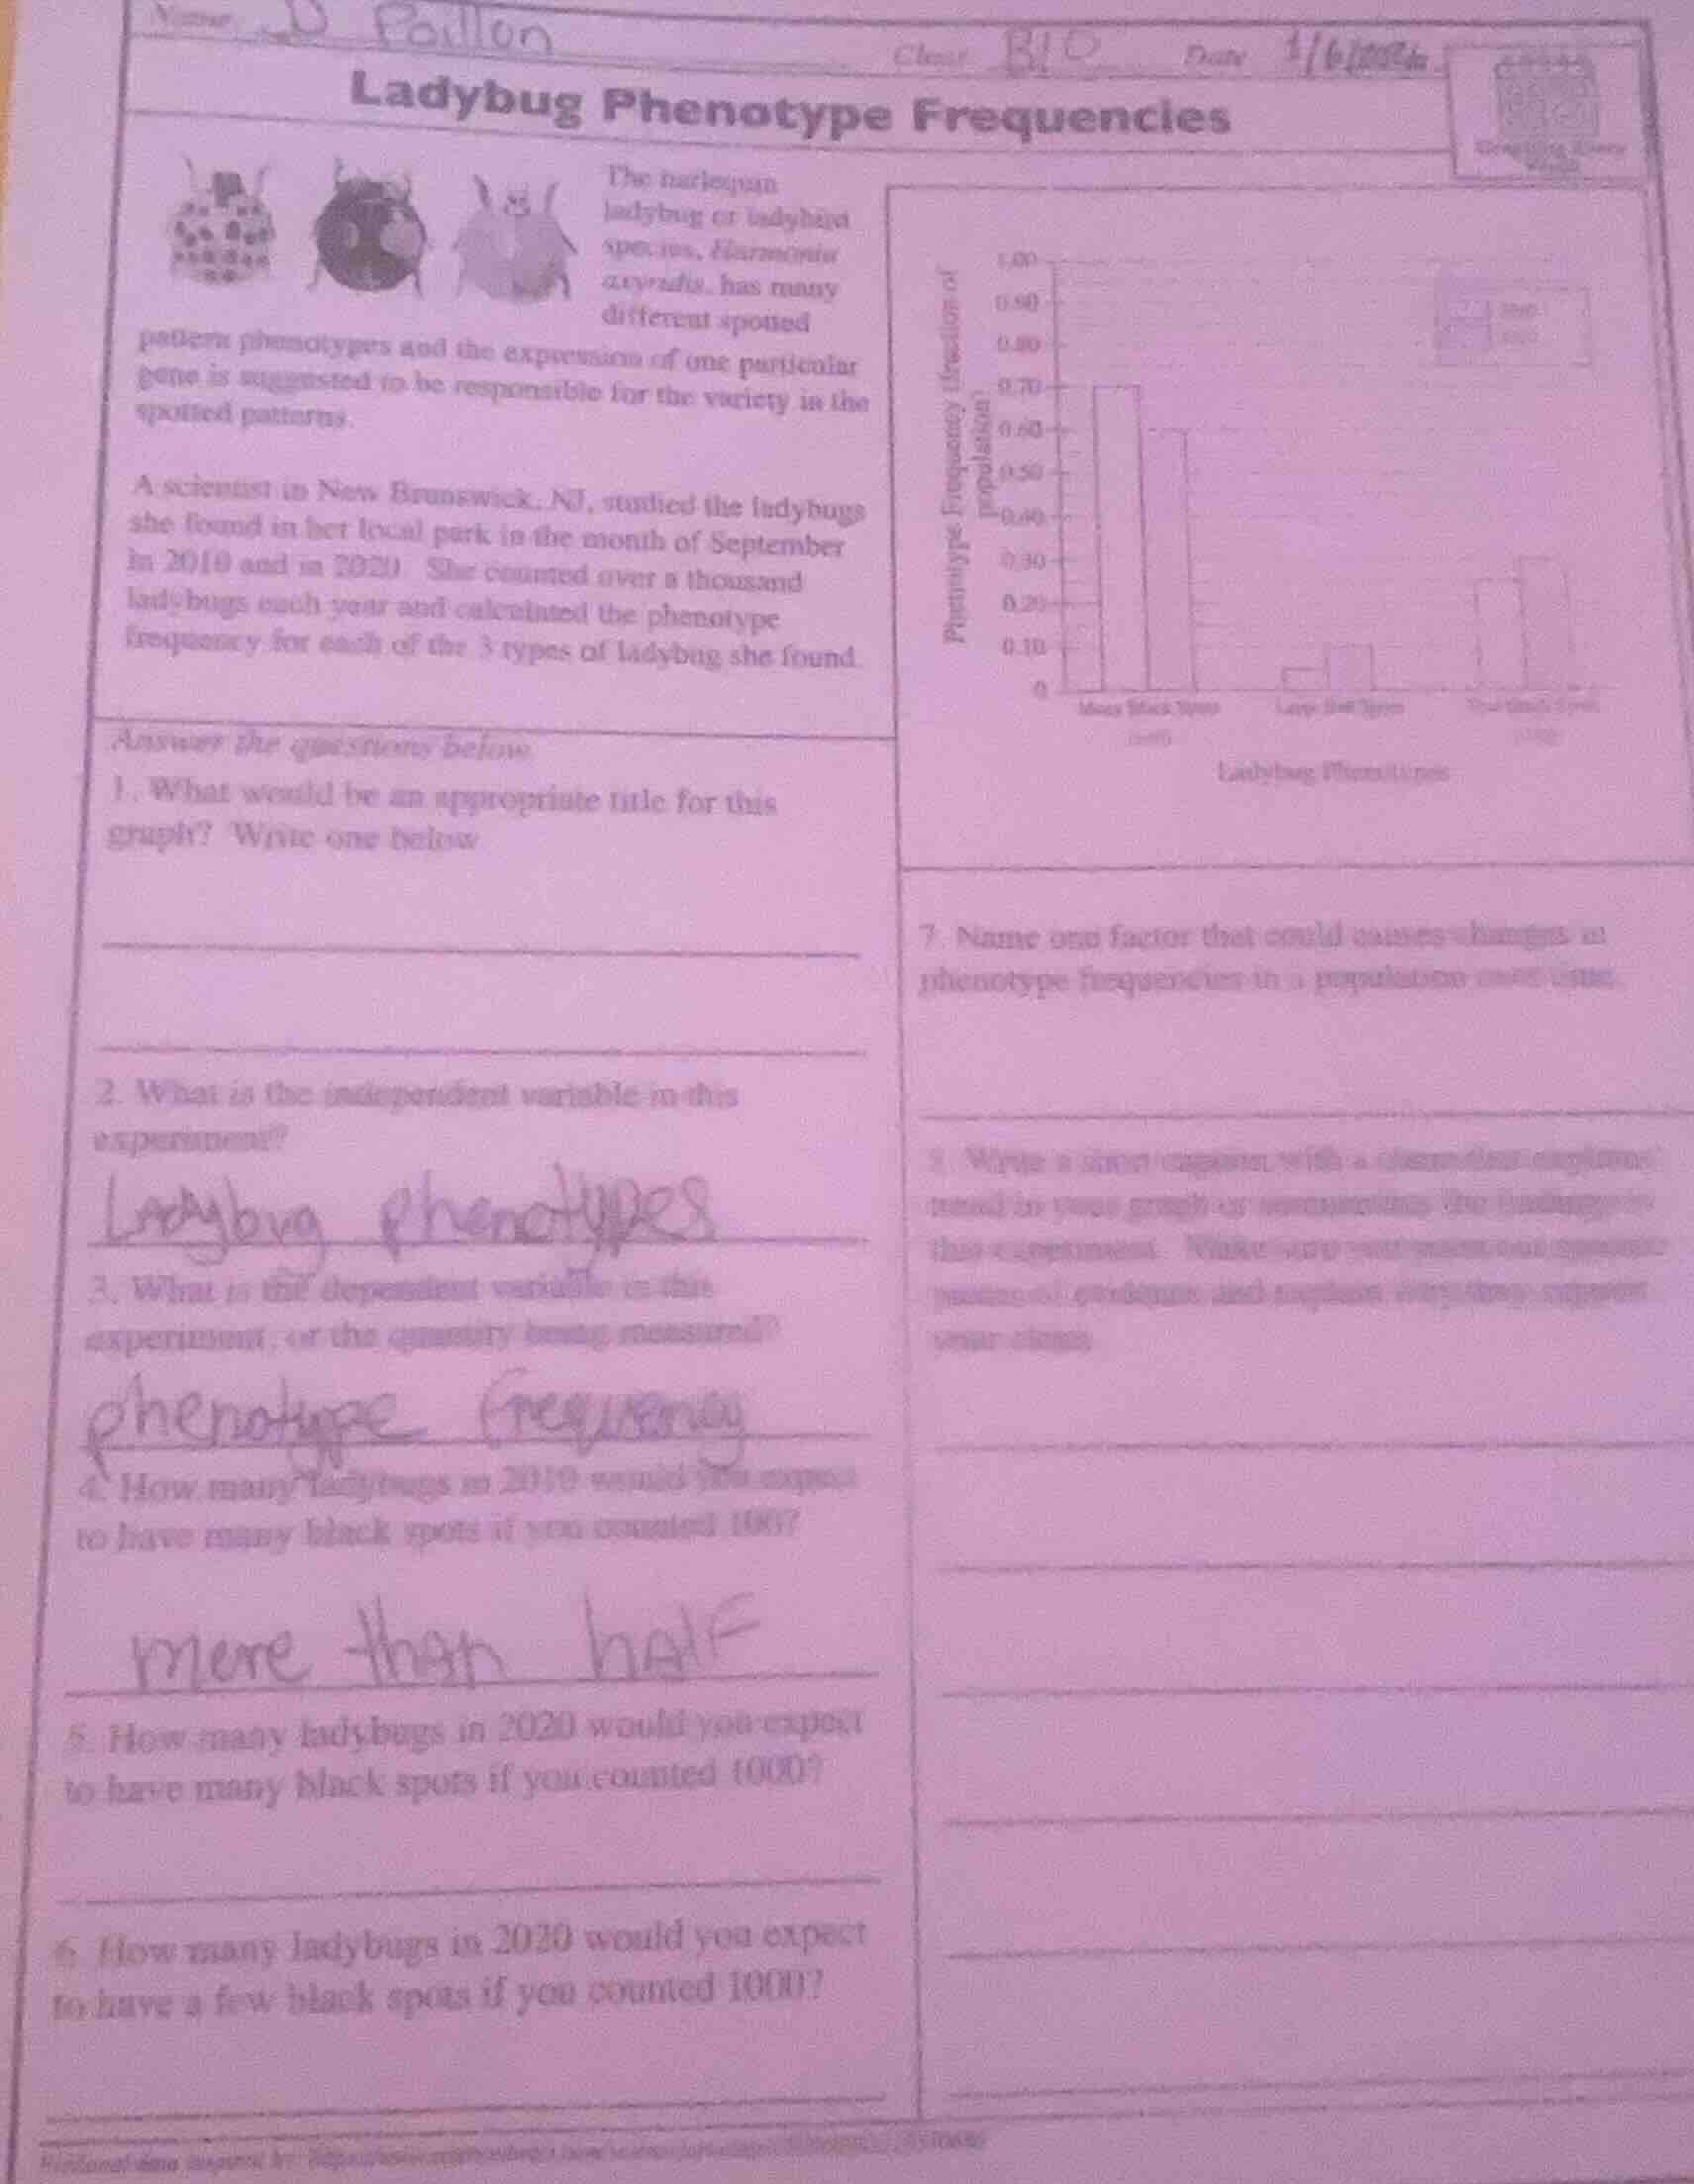
ladybug phenotype frequencies
the harlequin ladybug or ladybird species, harmonia axyridis, has many different spotted pattern phenotypes and the expression of one particular gene is suggested to be responsible for the variety in the spotted patterns.
a scientist in new brunswick, nj, studied the ladybugs she found in her local park in the month of september in 2010 and in 2020. she counted over a thousand ladybugs each year and calculated the phenotype frequency for each of the 3 types of ladybug she found.
answer the questions below
- what would be an appropriate title for this graph? write one below
_____________________________
_____________________________
- what is the independent variable in this experiment?
_____________________________
- what is the dependent variable in this experiment, or the quantity being measured?
_____________________________
- how many ladybugs in 2010 would you expect to have many black spots if you counted 100?
_____________________________
- how many ladybugs in 2020 would you expect to have many black spots if you counted 1000?
_____________________________
- how many ladybugs in 2030 would you expect to have a few black spots if you counted 1000?
_____________________________
- name one factor that could cause changes in phenotype frequencies in a population over time.
_____________________________
- write a short paragraph with a clear line of reasoning to justify the findings in this experiment. make sure your reasoning includes your personal opinion and explain why they support your claim.
_____________________________
_____________________________
_____________________________
_____________________________
Step1: Identify graph title focus
The graph compares phenotype frequencies of ladybug types across 2019 and 2020.
Step2: Calculate 2019 many black spots count
Use frequency from graph ($0.70$) × total ladybugs ($1000$):
$\text{Count} = 0.70 \times 1000 = 700$
Step3: Calculate 2020 many black spots count
Use frequency from graph ($0.60$) × total ladybugs ($1000$):
$\text{Count} = 0.60 \times 1000 = 600$
Step4: Calculate 2020 few black spots count
Use frequency from graph ($0.30$) × total ladybugs ($1000$):
$\text{Count} = 0.30 \times 1000 = 300$
Step5: List frequency change factor
Natural selection (or genetic drift, migration, mutation) can shift phenotype frequencies.

Snap & solve any problem in the app
Get step-by-step solutions on Sovi AI
Photo-based solutions with guided steps
Explore more problems and detailed explanations
- Appropriate graph title: Ladybug Phenotype Frequencies (2019 vs. 2020)
- Independent variable: Ladybug phenotypes
- Dependent variable: Phenotype frequency (fraction of population)
- 700
- 600
- 300
- Example factor: Natural selection (or genetic drift, gene flow, mutation)