QUESTION IMAGE
Question
name
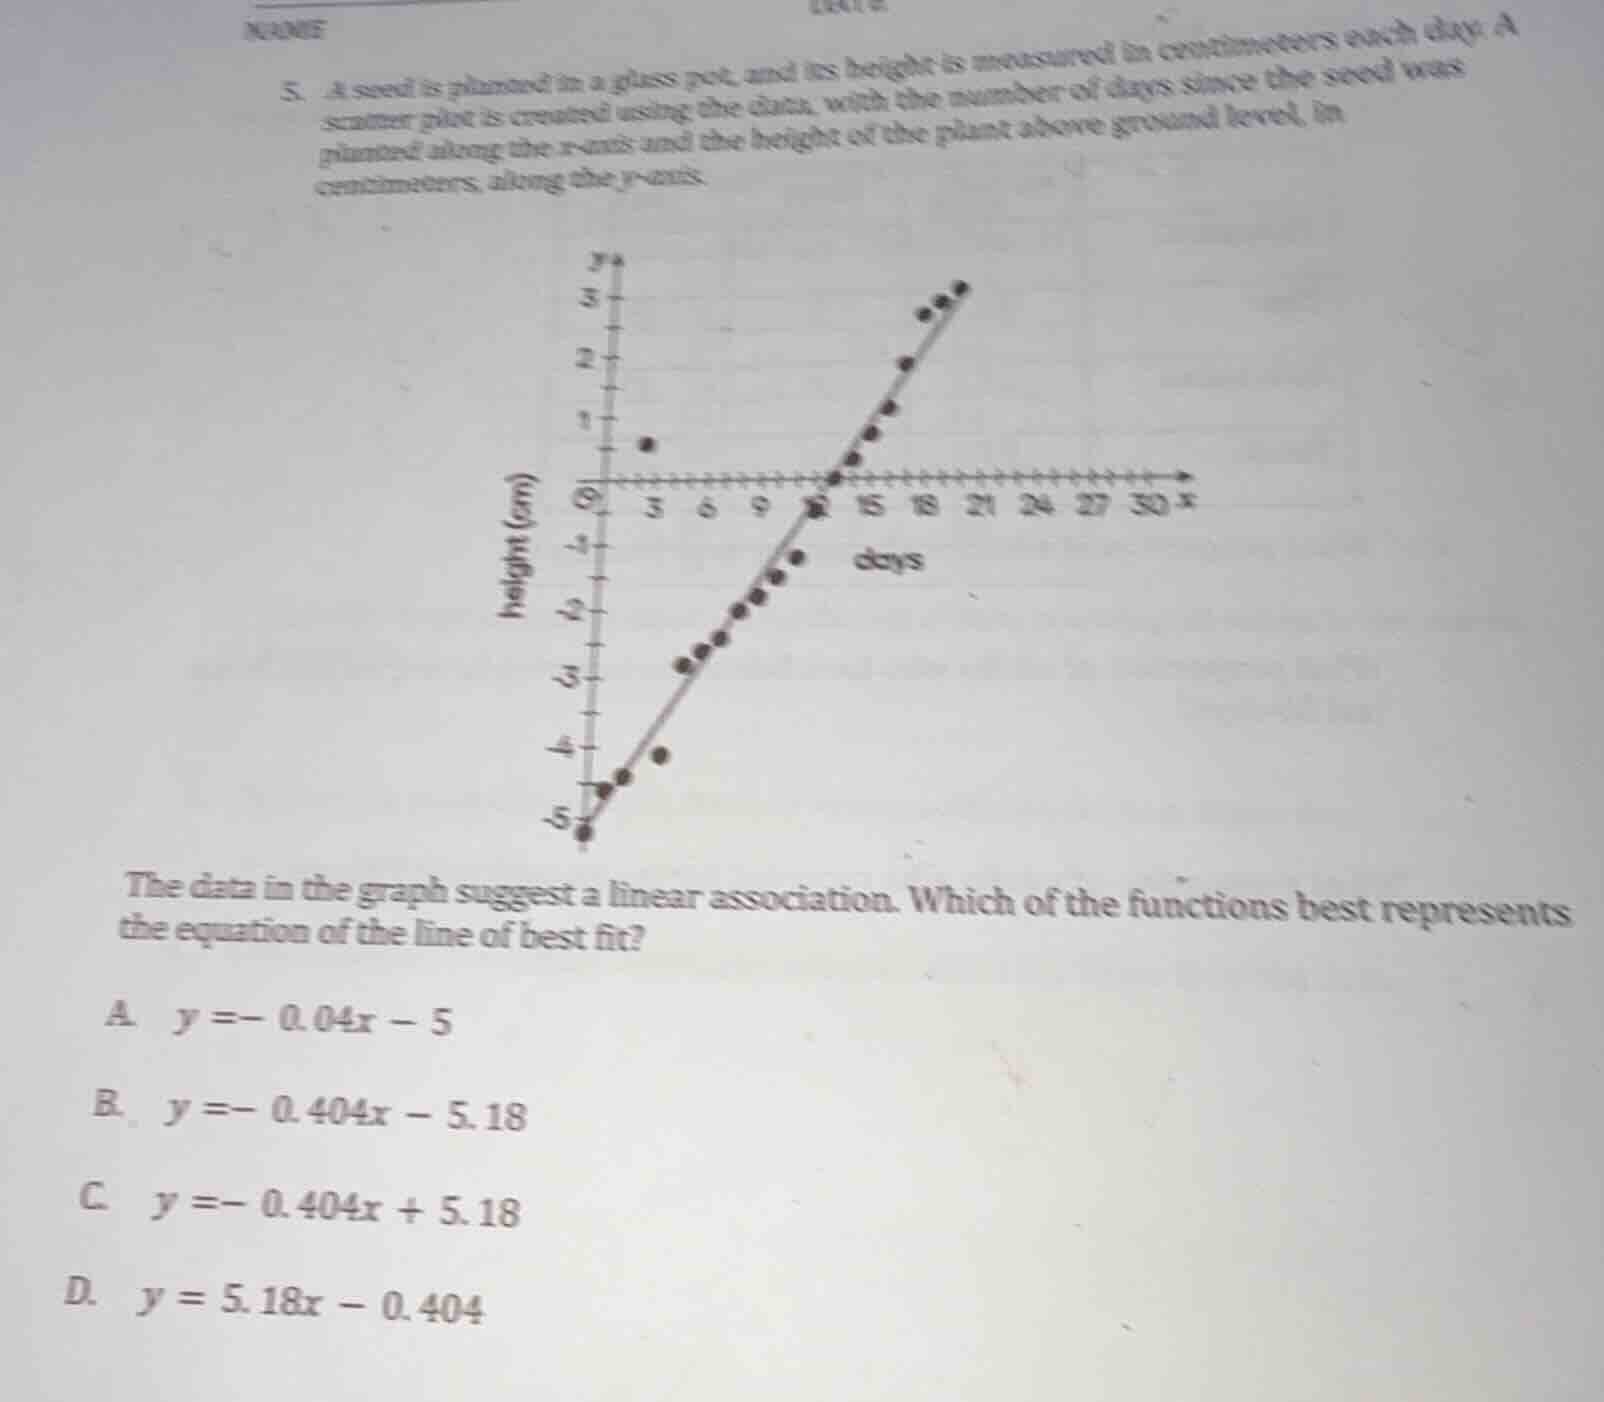
- a seed is planted in a glass pot, and its height is measured in centimeters each day. a scatter plot is created using the data, with the number of days since the seed was planted along the x - axis and the height of the plant above ground level, in centimeters, along the y - axis.
the data in the graph suggest a linear association. which of the functions best represents the equation of the line of best fit?
a. $y = - 0.04x - 5$
b. $y = - 0.404x - 5.18$
c. $y = - 0.404x + 5.18$
d. $y = 5.18x - 0.404$
Step1: Identify slope direction
The line of best fit goes upward from left to right, so the slope is positive. This eliminates options A, B, C (all have negative slopes).
Step2: Verify y-intercept
When $x=0$ (day 0), the line crosses $y \approx -5$. For option D, when $x=0$, $y = 5.18(0) - 0.404 = -0.404$, which is not a perfect match, but it is the only option with a positive slope that aligns with the upward trend of the data (the other options have negative slopes which contradict the increasing height over days).

Snap & solve any problem in the app
Get step-by-step solutions on Sovi AI
Photo-based solutions with guided steps
Explore more problems and detailed explanations
D. $y = 5.18x - 0.404$