QUESTION IMAGE
Question
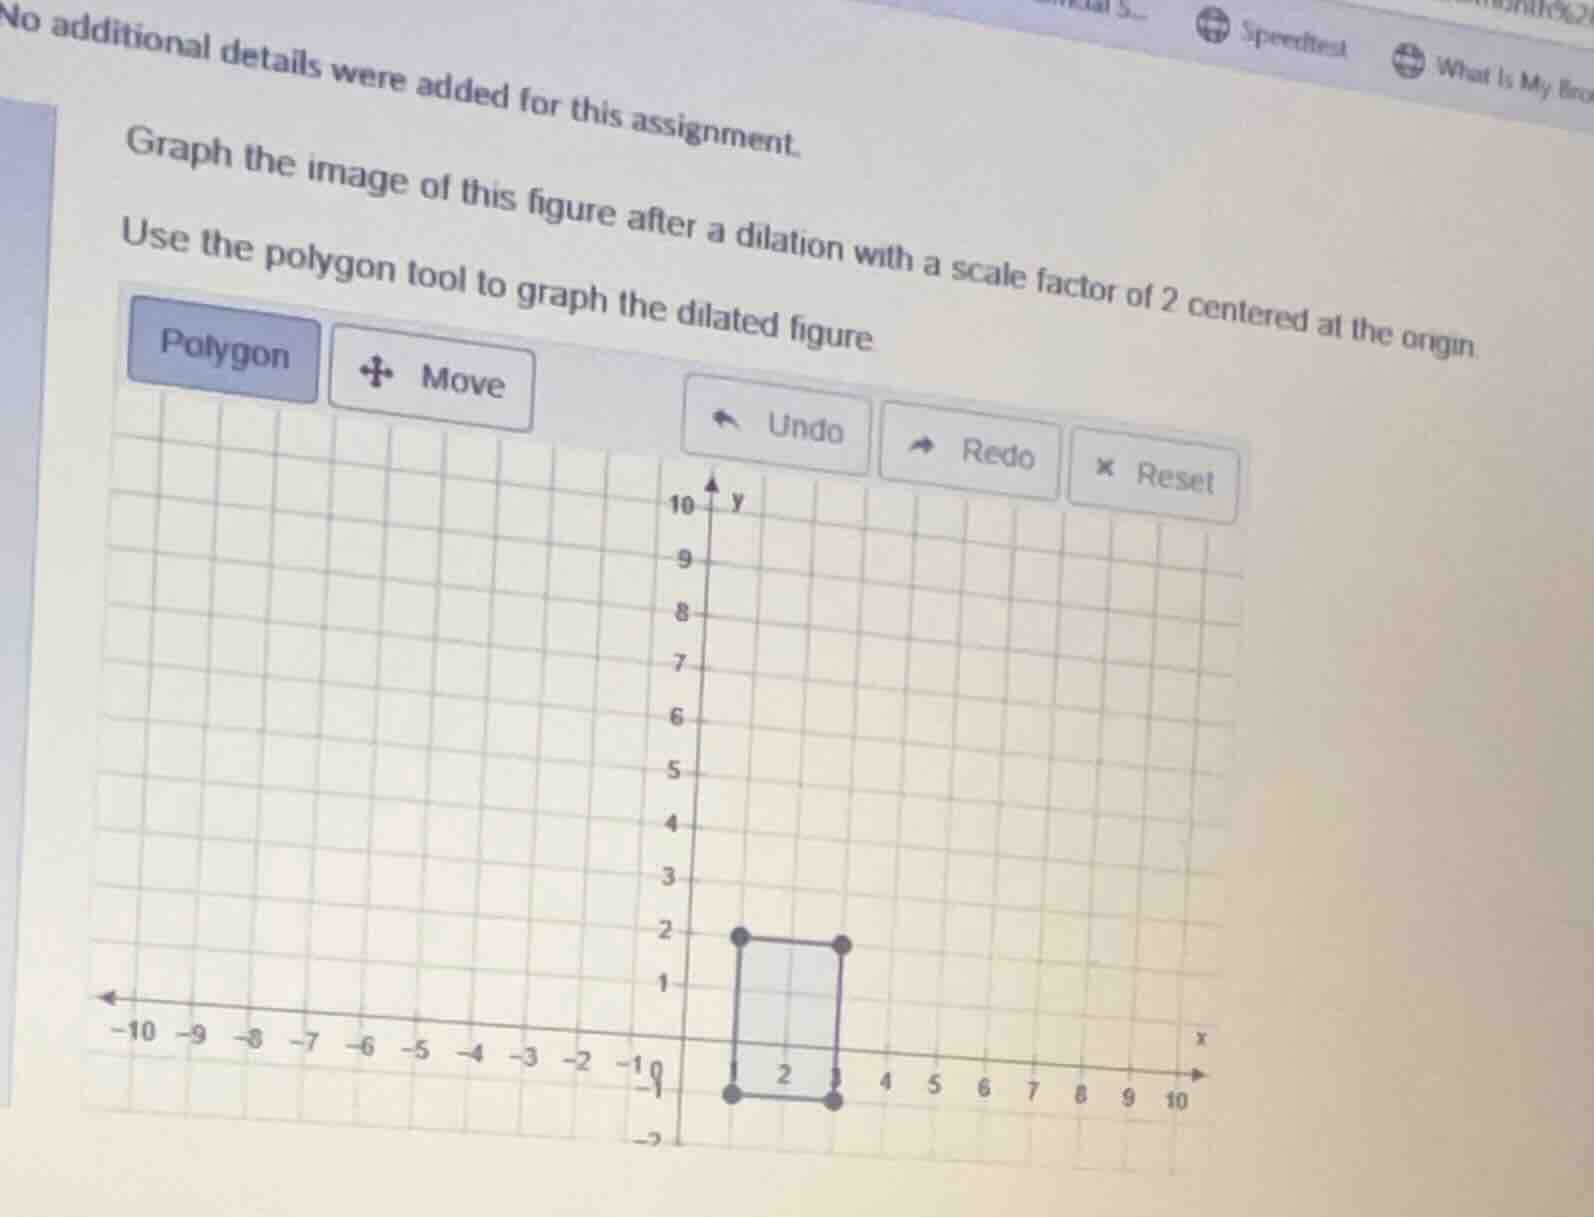
no additional details were added for this assignment. graph the image of this figure after a dilation with a scale factor of 2 centered at the origin. use the polygon tool to graph the dilated figure
Step1: Identify original vertices
The original figure (a rectangle) has vertices at \((1, 2)\), \((3, 2)\), \((3, -1)\), and \((1, -1)\).
Step2: Apply dilation rule
Dilation centered at the origin with scale factor \(k\) transforms a point \((x, y)\) to \((k \cdot x, k \cdot y)\). Here, \(k = 2\).
- For \((1, 2)\): \( (2 \cdot 1, 2 \cdot 2) = (2, 4) \)
- For \((3, 2)\): \( (2 \cdot 3, 2 \cdot 2) = (6, 4) \)
- For \((3, -1)\): \( (2 \cdot 3, 2 \cdot (-1)) = (6, -2) \)
- For \((1, -1)\): \( (2 \cdot 1, 2 \cdot (-1)) = (2, -2) \)
Step3: Plot dilated vertices
Plot the points \((2, 4)\), \((6, 4)\), \((6, -2)\), and \((2, -2)\) on the coordinate plane and connect them with the polygon tool.

Snap & solve any problem in the app
Get step-by-step solutions on Sovi AI
Photo-based solutions with guided steps
Explore more problems and detailed explanations
To graph the dilated figure, plot the vertices \((2, 4)\), \((6, 4)\), \((6, -2)\), and \((2, -2)\) and connect them using the polygon tool. The dilated figure is a rectangle with these vertices, scaled by a factor of 2 from the origin.