QUESTION IMAGE
Question
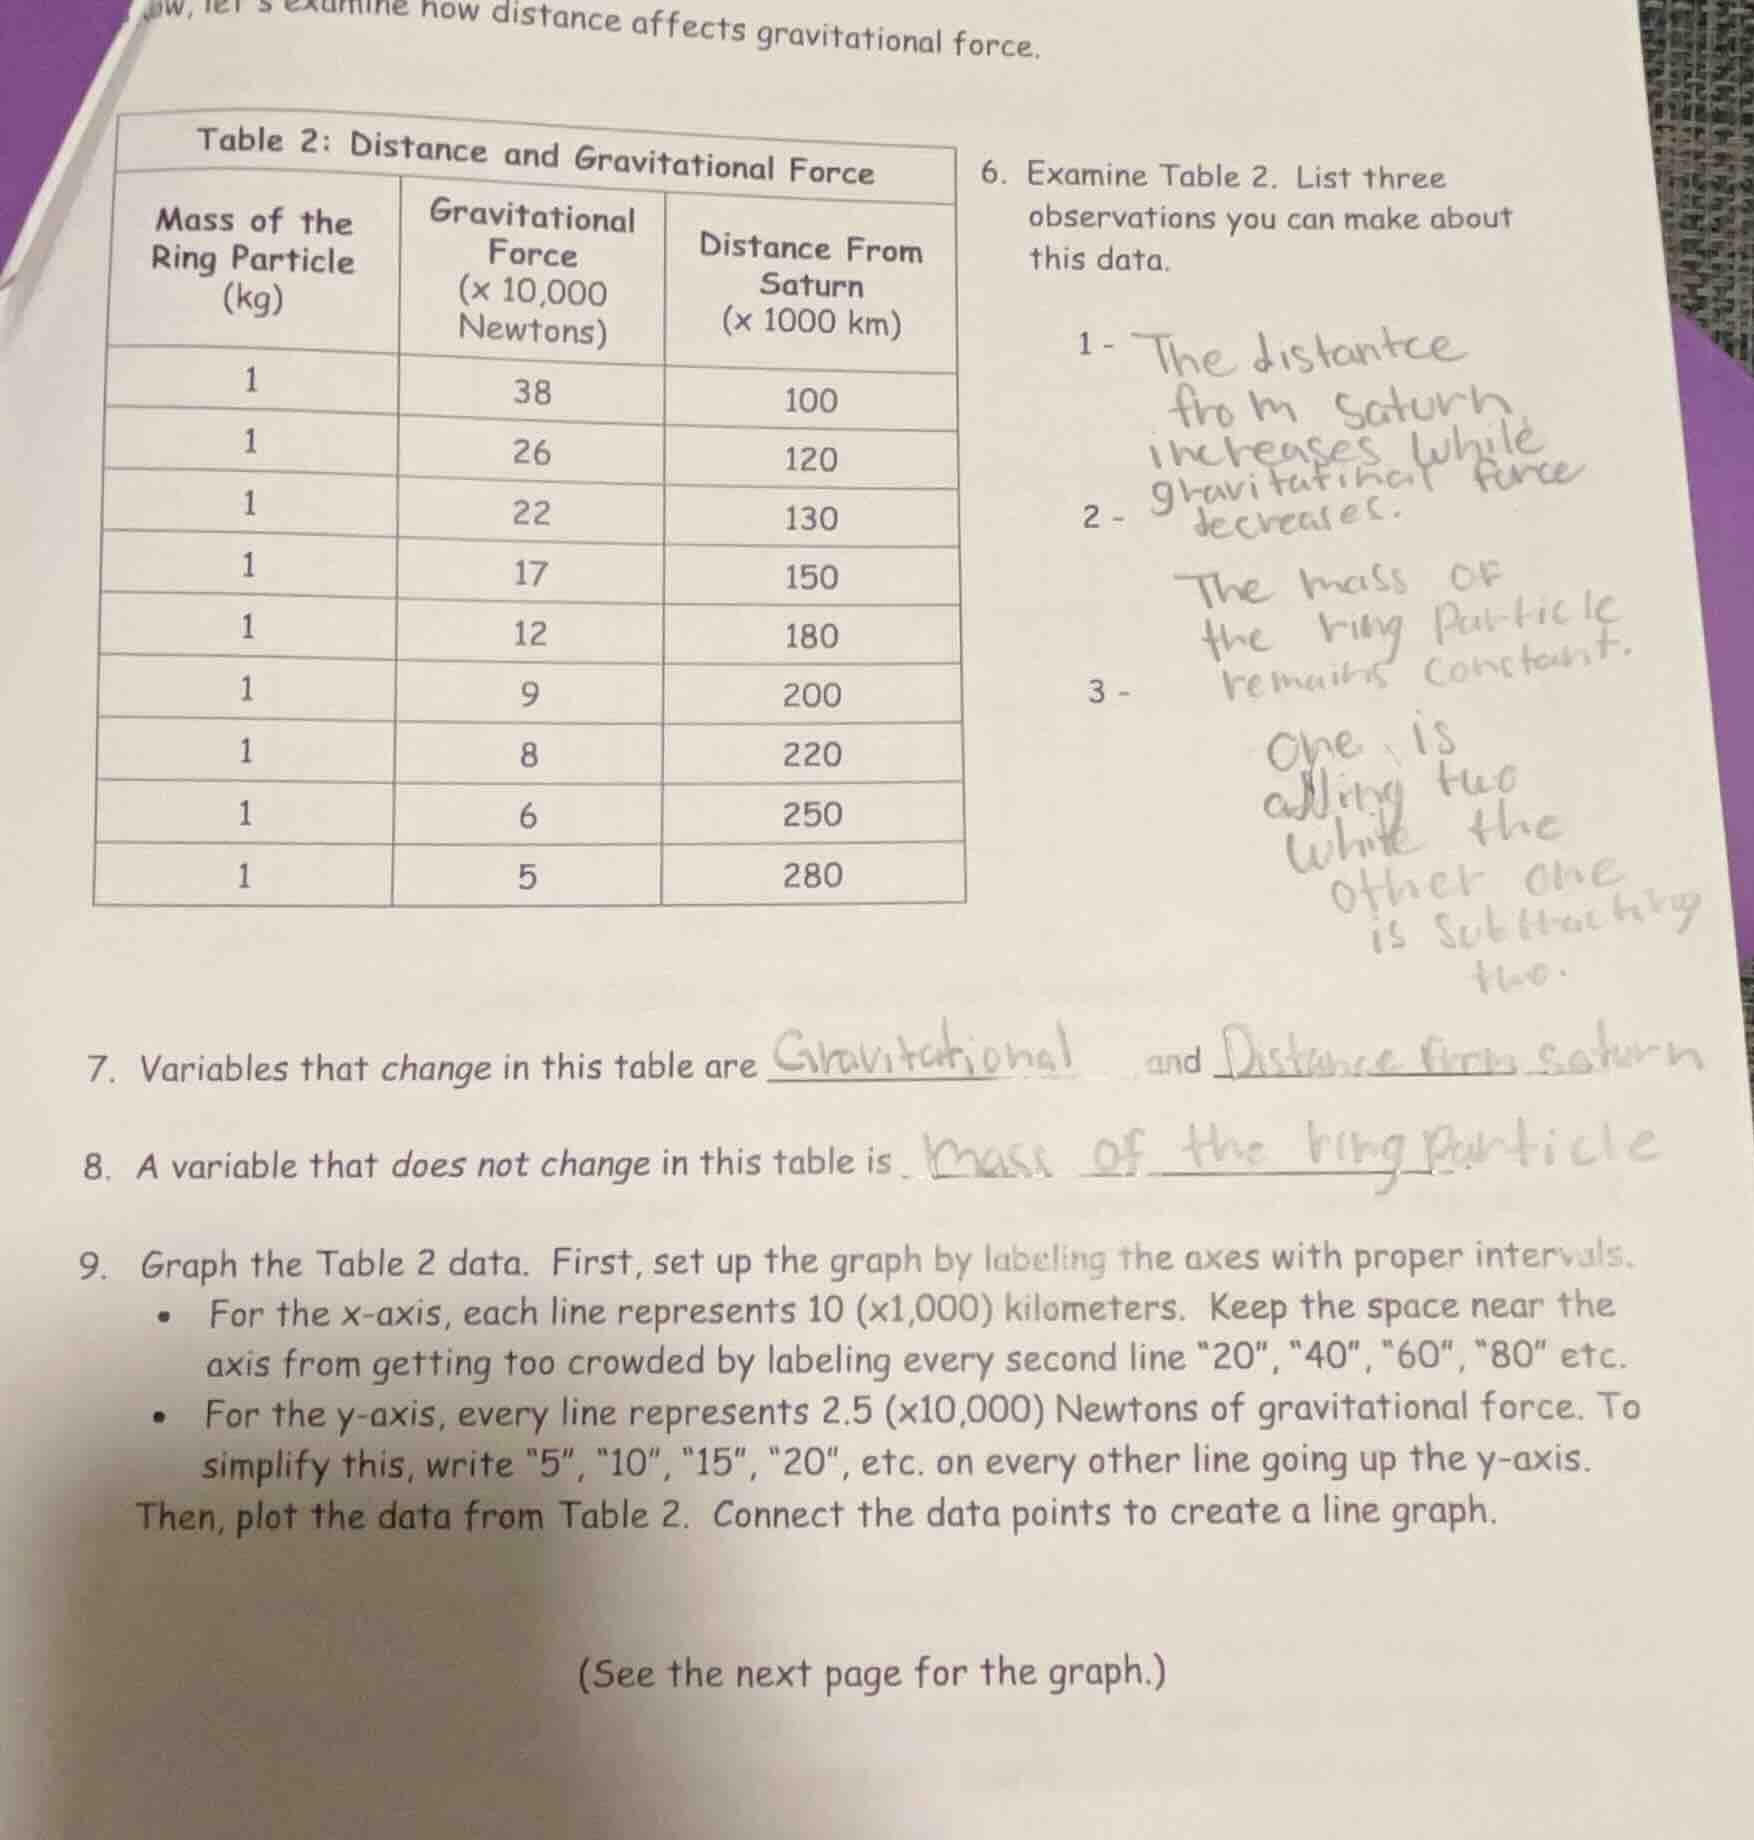
now, lets examine how distance affects gravitational force.
table 2: distance and gravitational force
- examine table 2. list three observations you can make about this data.
- variables that change in this table are __ and __
- a variable that does not change in this table is ____
- graph the table 2 data. first, set up the graph by labeling the axes with proper intervals.
- for the x - axis, each line represents 10 (×1,000) kilometers. keep the space near the axis from getting too crowded by labeling every second line \20\, \40\, \60\, \80\ etc.
- for the y - axis, every line represents 2.5 (×10,000) newtons of gravitational force. to simplify this, write \5\, \10\, \15\, \20\, etc. on every other line going up the y - axis.
then, plot the data from table 2. connect the data points to create a line graph.
(see the next page for the graph.)
| mass of the ring particle (kg) | gravitational force (×10,000 newtons) | distance from saturn (×1000 km) |
|---|---|---|
| 1 | 26 | 120 |
| 1 | 22 | 130 |
| 1 | 17 | 150 |
| 1 | 12 | 180 |
| 1 | 9 | 200 |
| 1 | 8 | 220 |
| 1 | 6 | 250 |
| 1 | 5 | 280 |
Brief Explanations
For question 6, observations are derived directly from analyzing the table's data trends and consistent values. For questions 7 and 8, variables are identified by checking which columns have changing values (variables) and which has a fixed value (constant).

Snap & solve any problem in the app
Get step-by-step solutions on Sovi AI
Photo-based solutions with guided steps
Explore more problems and detailed explanations
6.
- As distance from Saturn increases, gravitational force decreases.
- The mass of the ring particle stays constant at 1 kg.
- Gravitational force decreases by larger amounts when distance increases by larger intervals (e.g., 100→120 km: force drops 12; 250→280 km: force drops 1).
- Gravitational Force, Distance From Saturn
- Mass of the Ring Particle
- (Graph setup and plotting instructions follow:
- X-axis (Distance From Saturn, ×1000 km): Label every second line as 20, 40, 60, ..., 300 (each line = 10 units)
- Y-axis (Gravitational Force, ×10,000 Newtons): Label every second line as 5, 10, 15, ..., 40 (each line = 2.5 units)
- Plot points: (100, 38), (120, 26), (130, 22), (150, 17), (180, 12), (200, 9), (220, 8), (250, 6), (280, 5)
- Connect all plotted points with a line)