QUESTION IMAGE
Question
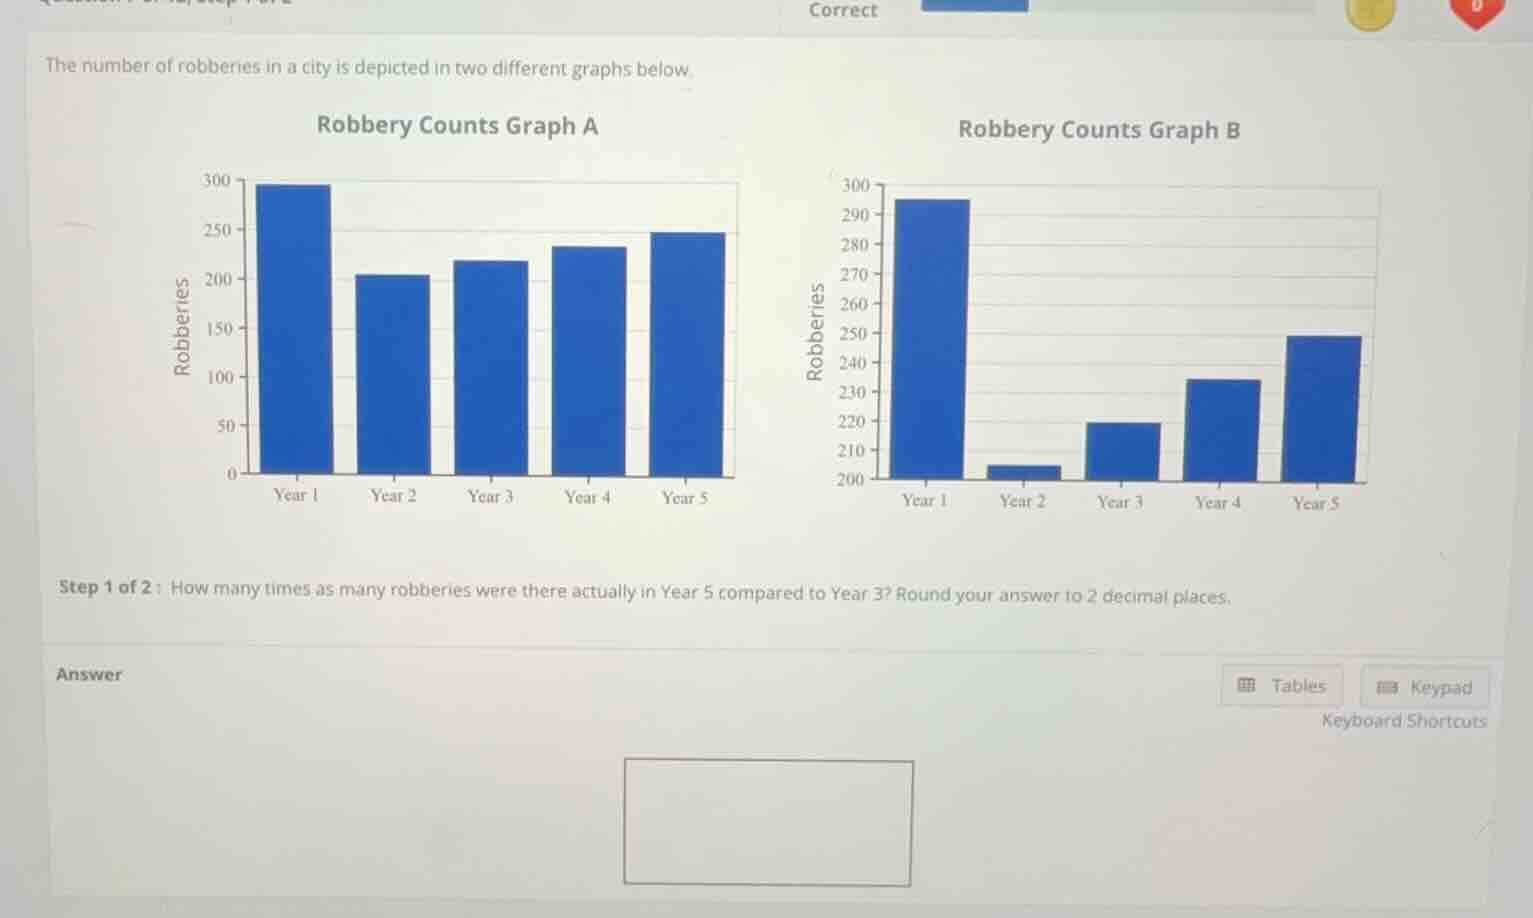
the number of robberies in a city is depicted in two different graphs below. robbery counts graph a robbery counts graph b step 1 of 2 : how many times as many robberies were there actually in year 5 compared to year 3? round your answer to 2 decimal places. answer
Step1: Identify Year 3 and 5 values
From Graph A (actual counts): Year 3 robberies = 220, Year 5 robberies = 245
Step2: Calculate ratio of Year5 to Year3
$\frac{\text{Year 5 Robberies}}{\text{Year 3 Robberies}} = \frac{245}{220}$
Step3: Compute and round to 2 decimals
$\frac{245}{220} \approx 1.11$

Snap & solve any problem in the app
Get step-by-step solutions on Sovi AI
Photo-based solutions with guided steps
Explore more problems and detailed explanations
1.11