QUESTION IMAGE
Question
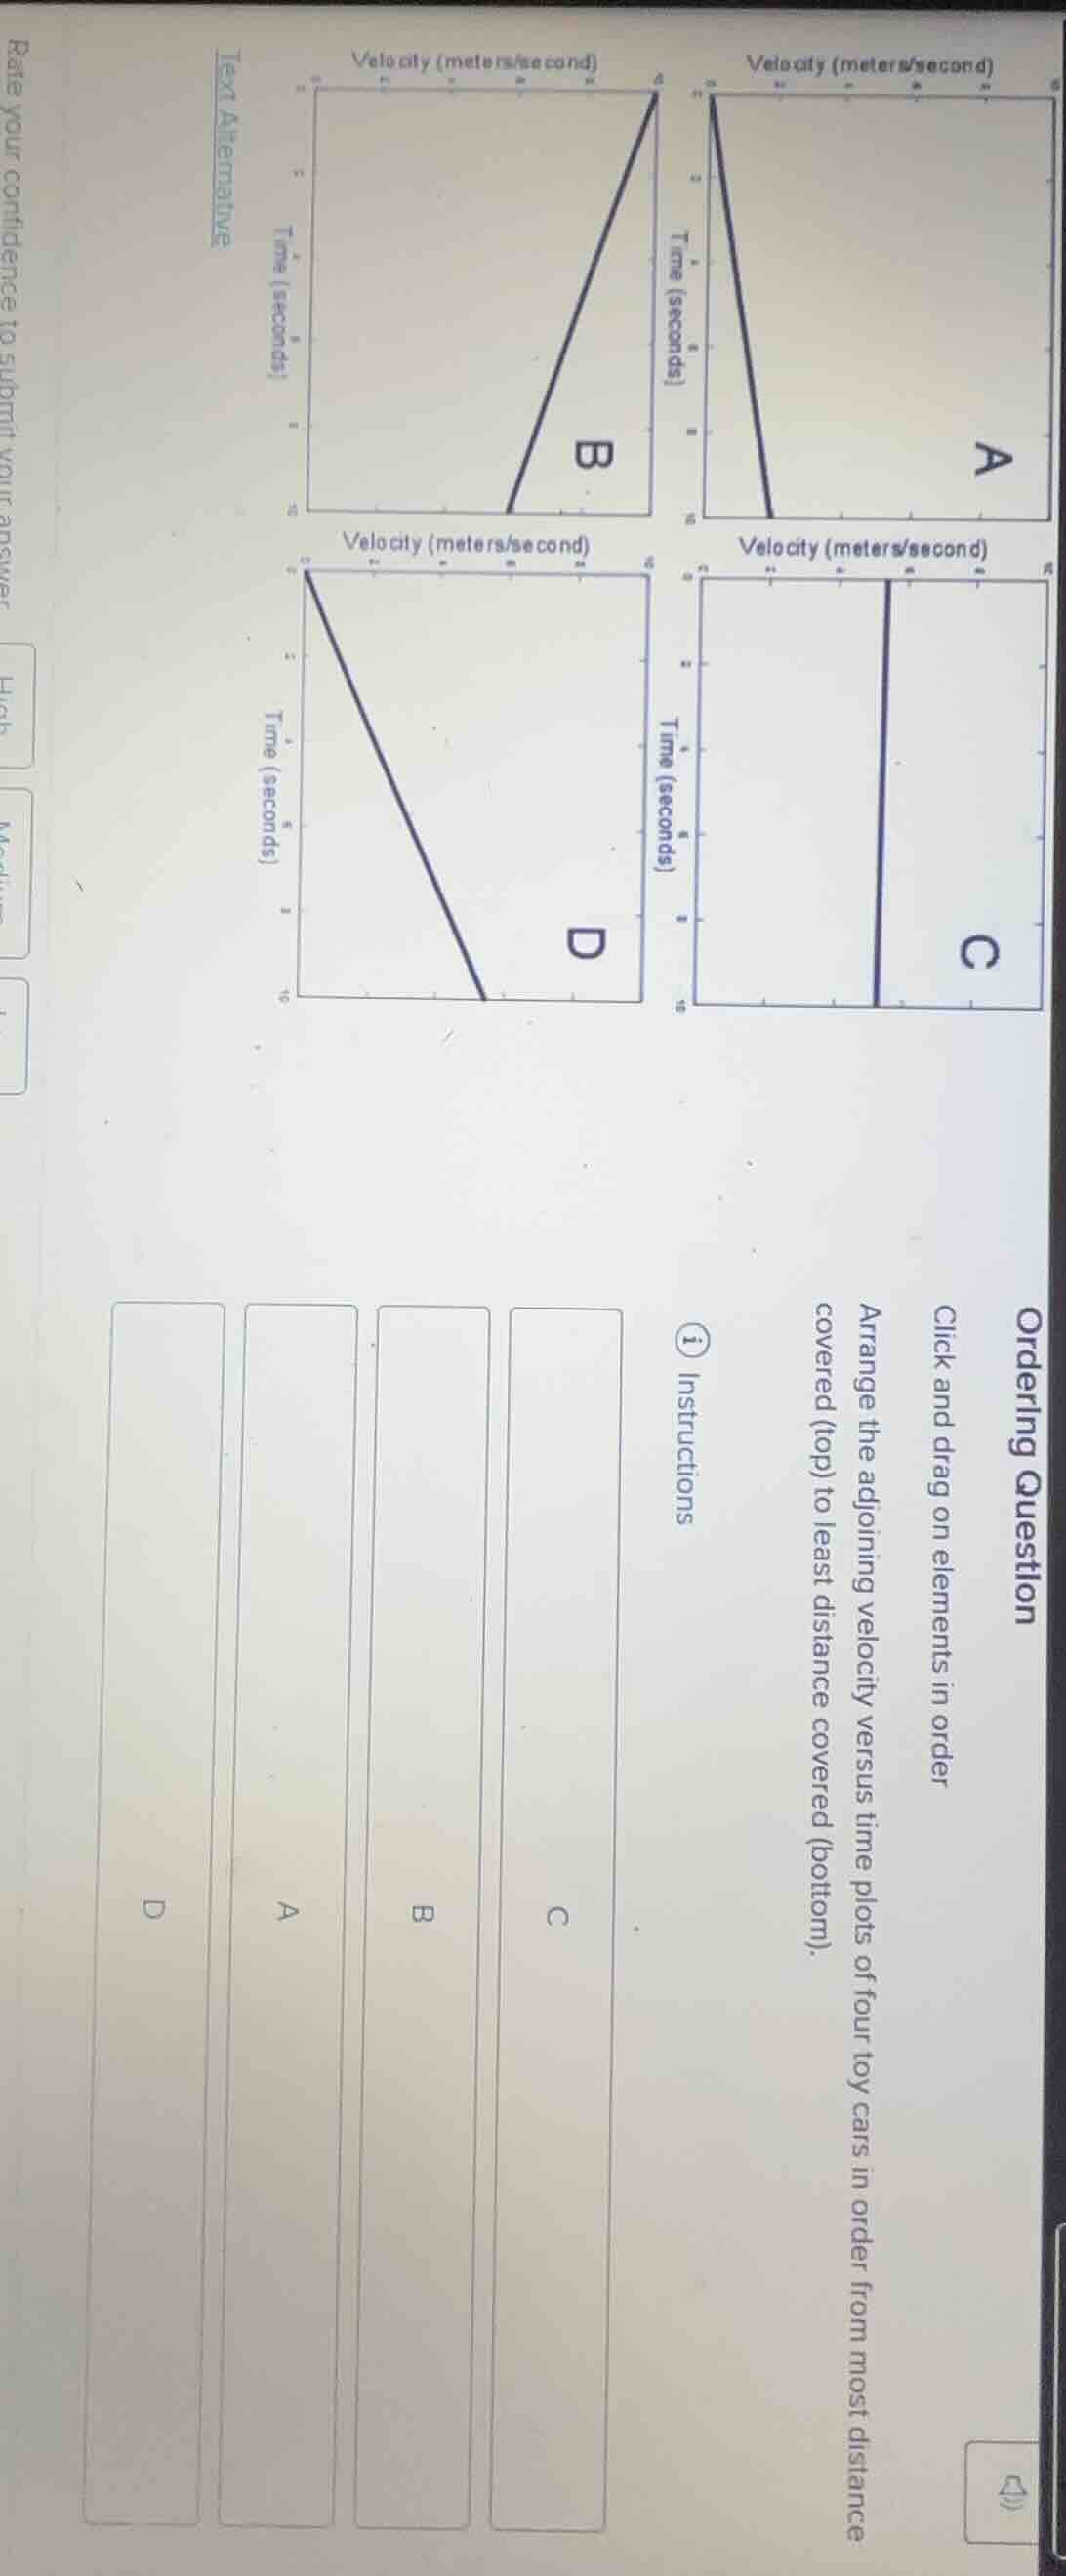
ordering question
click and drag on elements in order
arrange the adjoining velocity versus time plots of four toy cars in order from most distance covered (top) to least distance covered (bottom).
instructions
Step1: Recall distance-velocity-time relation
Distance = Area under velocity-time graph
Step2: Calculate area for Plot A
The graph is a triangle with base $t=2$ s, height $v=6$ m/s.
Area = $\frac{1}{2} \times 2 \times 6 = 6$ meters
Step3: Calculate area for Plot B
The graph is a triangle with base $t=3$ s, height $v=6$ m/s.
Area = $\frac{1}{2} \times 3 \times 6 = 9$ meters
Step4: Calculate area for Plot C
The graph is a rectangle with base $t=4$ s, height $v=6$ m/s.
Area = $4 \times 6 = 24$ meters
Step5: Calculate area for Plot D
The graph is a triangle with base $t=4$ s, height $v=6$ m/s.
Area = $\frac{1}{2} \times 4 \times 6 = 12$ meters
Step6: Order areas from largest to smallest
$24 > 12 > 9 > 6$, so C > D > B > A.

Snap & solve any problem in the app
Get step-by-step solutions on Sovi AI
Photo-based solutions with guided steps
Explore more problems and detailed explanations
- C
- D
- B
- A