QUESTION IMAGE
Question
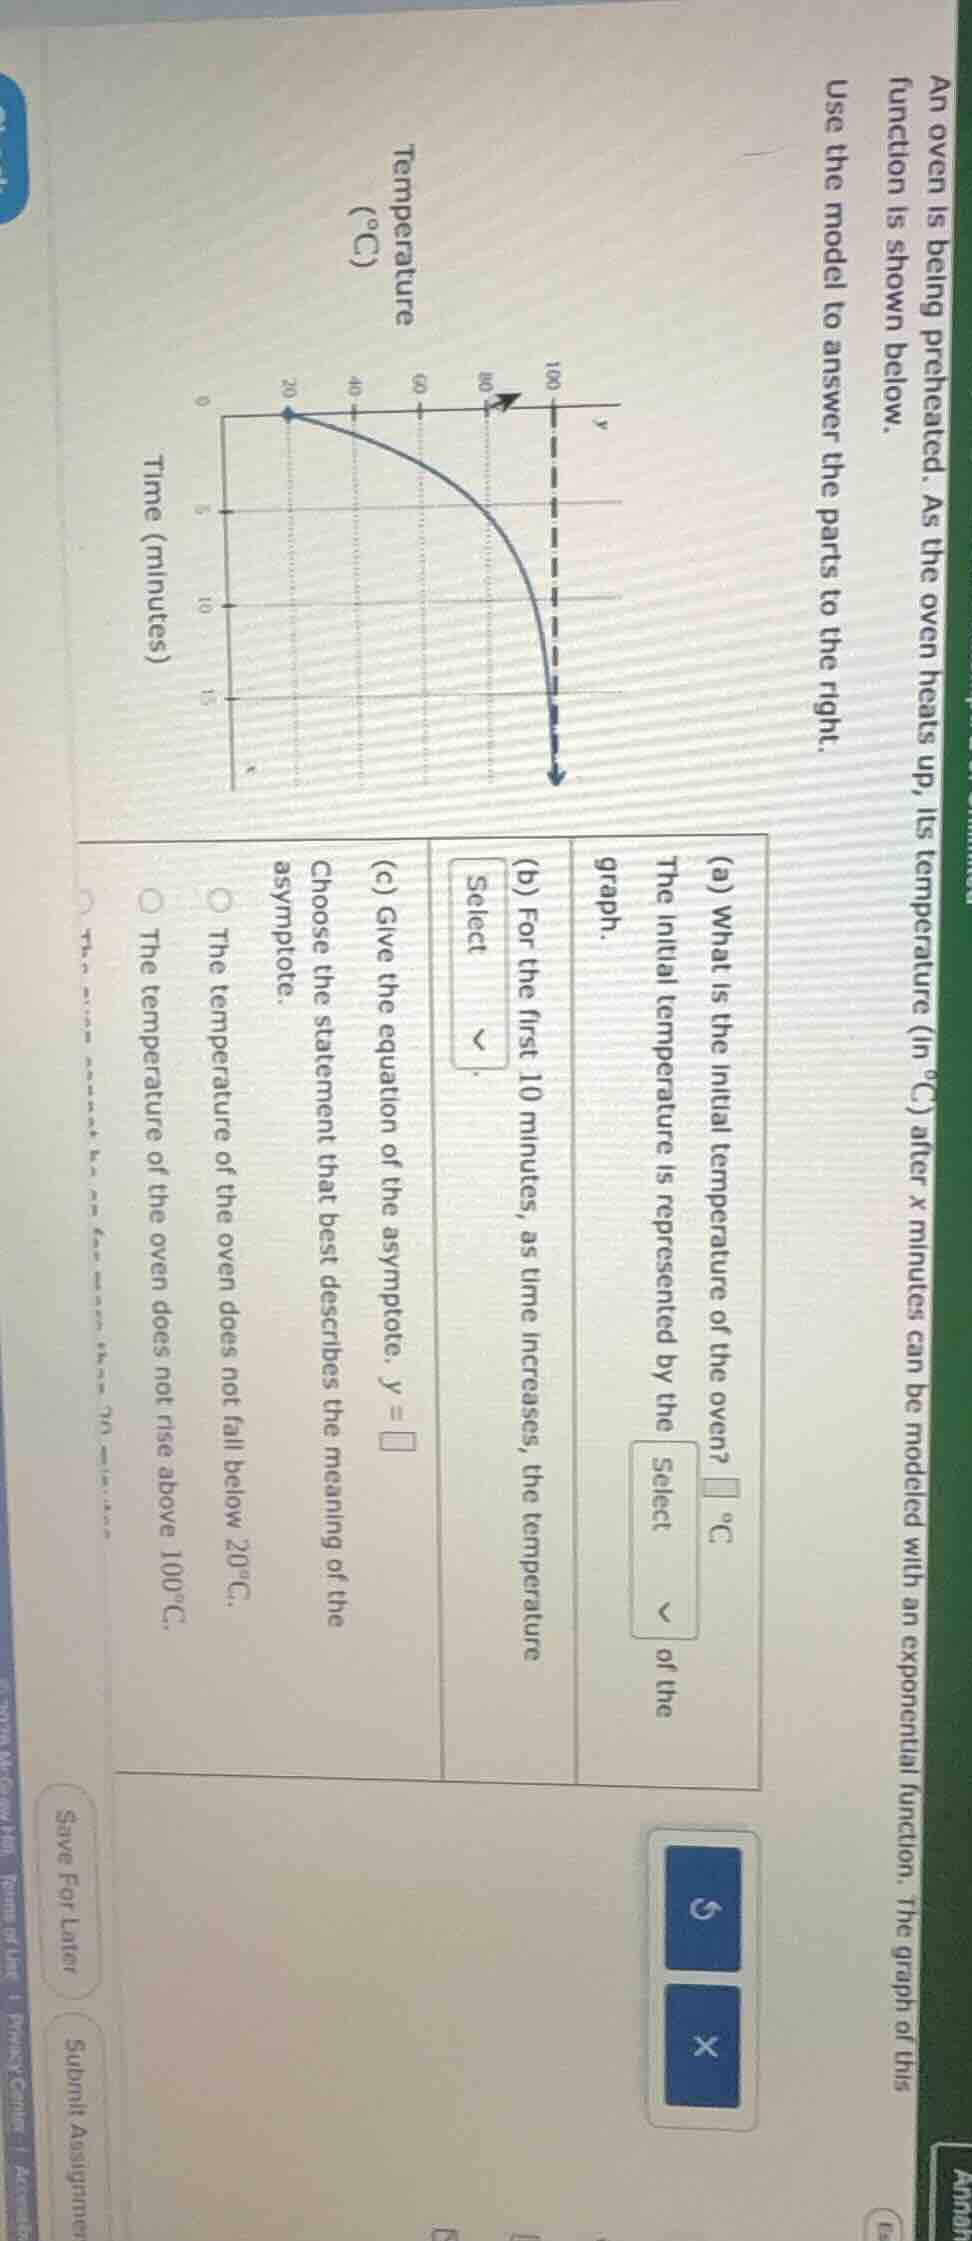
an oven is being preheated. as the oven heats up, its temperature (in °c) after x minutes can be modeled with an exponential function. the graph of this function is shown below. use the model to answer the parts to the right. (a) what is the initial temperature of the oven? \\(\square\\) °c the initial temperature is represented by the \\(\boldsymbol{\text{select}}\\) of the graph. (b) for the first 10 minutes, as time increases, the temperature \\(\boldsymbol{\text{select}}\\). (c) give the equation of the asymptote. \\(y = \square\\) choose the statement that best describes the meaning of the asymptote. \\(\bigcirc\\) the temperature of the oven does not fall below 20°c. \\(\bigcirc\\) the temperature of the oven does not rise above 100°c. \\(\bigcirc\\) the...
Step1: Identify initial temperature
Look at $x=0$ on the graph: $y=20$
Step2: Analyze first 10 mins trend
Observe curve: temperature rises toward 100.
Step3: Find horizontal asymptote
The curve approaches $y=100$.
Step4: Interpret asymptote meaning
The oven's temp nears 100, does not exceed it.

Snap & solve any problem in the app
Get step-by-step solutions on Sovi AI
Photo-based solutions with guided steps
Explore more problems and detailed explanations
(a) $20$ °C; The initial temperature is represented by the y-intercept of the graph.
(b) increases towards 100°C
(c) $y=100$; The correct statement is: The temperature of the oven does not rise above 100°C.