QUESTION IMAGE
Question
the owner of a hair salon franchise in the city asked all of her stylists to report how many new clients they serviced within the last year. the list of new clients serviced is shown below.
number of new clients serviced over the past year: 59, 32, 37, 53, 10, 12, 57, 50, 48, 50, 61, 37, 35, 44, 49, 55, 59, 62, 43, 48, 59, 61, 64, 37, 18, 11, 44, 50, 57, 63, 47, 27
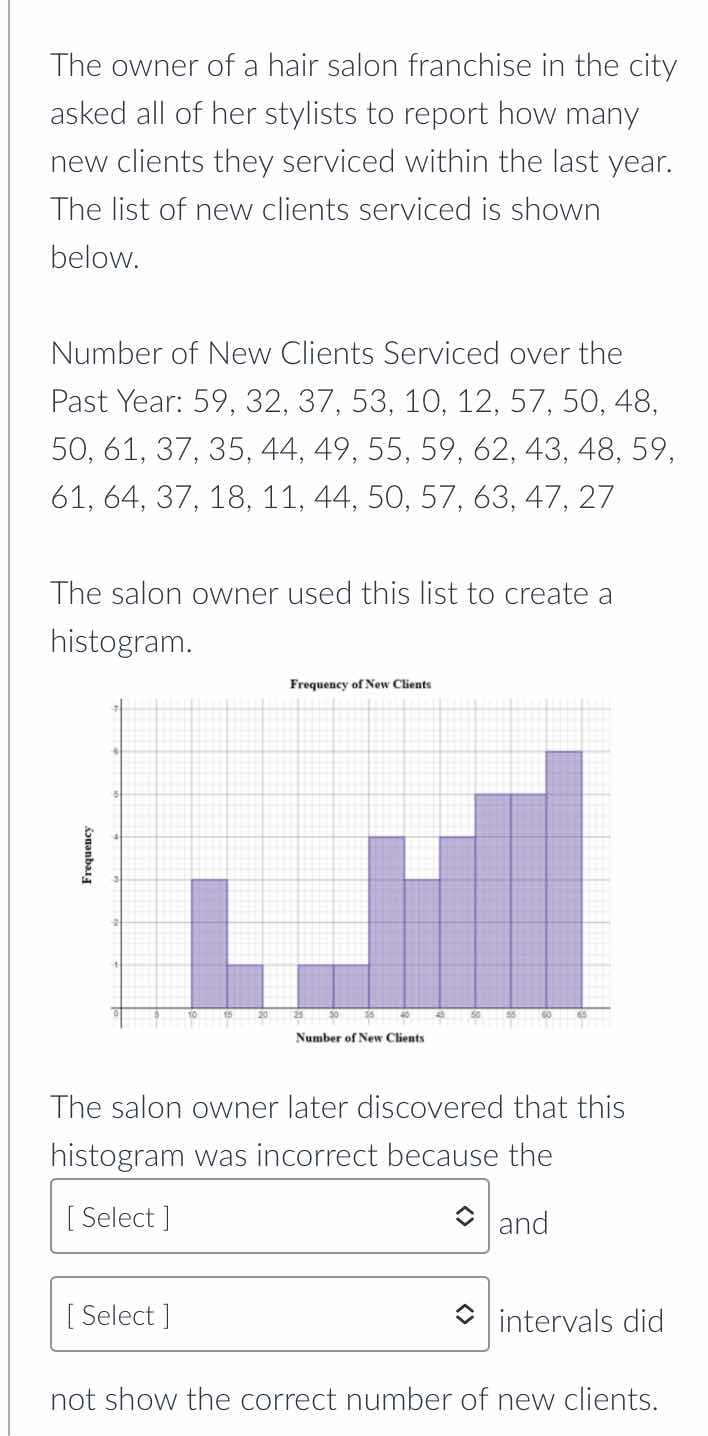
the salon owner used this list to create a histogram.
histogram image: frequency of new clients, x-axis: number of new clients, y-axis: frequency
the salon owner later discovered that this histogram was incorrect because the select and select intervals did not show the correct number of new clients.
First, we organize the data into ordered values: 10, 11, 12, 18, 27, 32, 35, 37, 37, 37, 43, 44, 44, 47, 48, 48, 49, 50, 50, 50, 53, 55, 57, 57, 59, 59, 59, 61, 61, 62, 63, 64.
Next, we check the histogram's intervals. The first interval on the histogram appears to cover 10-20, but the frequency shown is 1, while there are 4 values (10,11,12,18) in this range. The second interval (20-30) has a frequency of 3, but only 2 values (27,32? No, 32 is 30-40) — actually, 27 is the only value in 20-30, so the histogram misrepresents this interval. The key incorrect intervals are the 10-20 (under-counted) and 20-30 (over-counted) ranges, or more accurately, the intervals 10-20 and 20-30 do not match the actual data frequencies.

Snap & solve any problem in the app
Get step-by-step solutions on Sovi AI
Photo-based solutions with guided steps
Explore more problems and detailed explanations
First [Select] box: 10-20
Second [Select] box: 20-30