QUESTION IMAGE
Question
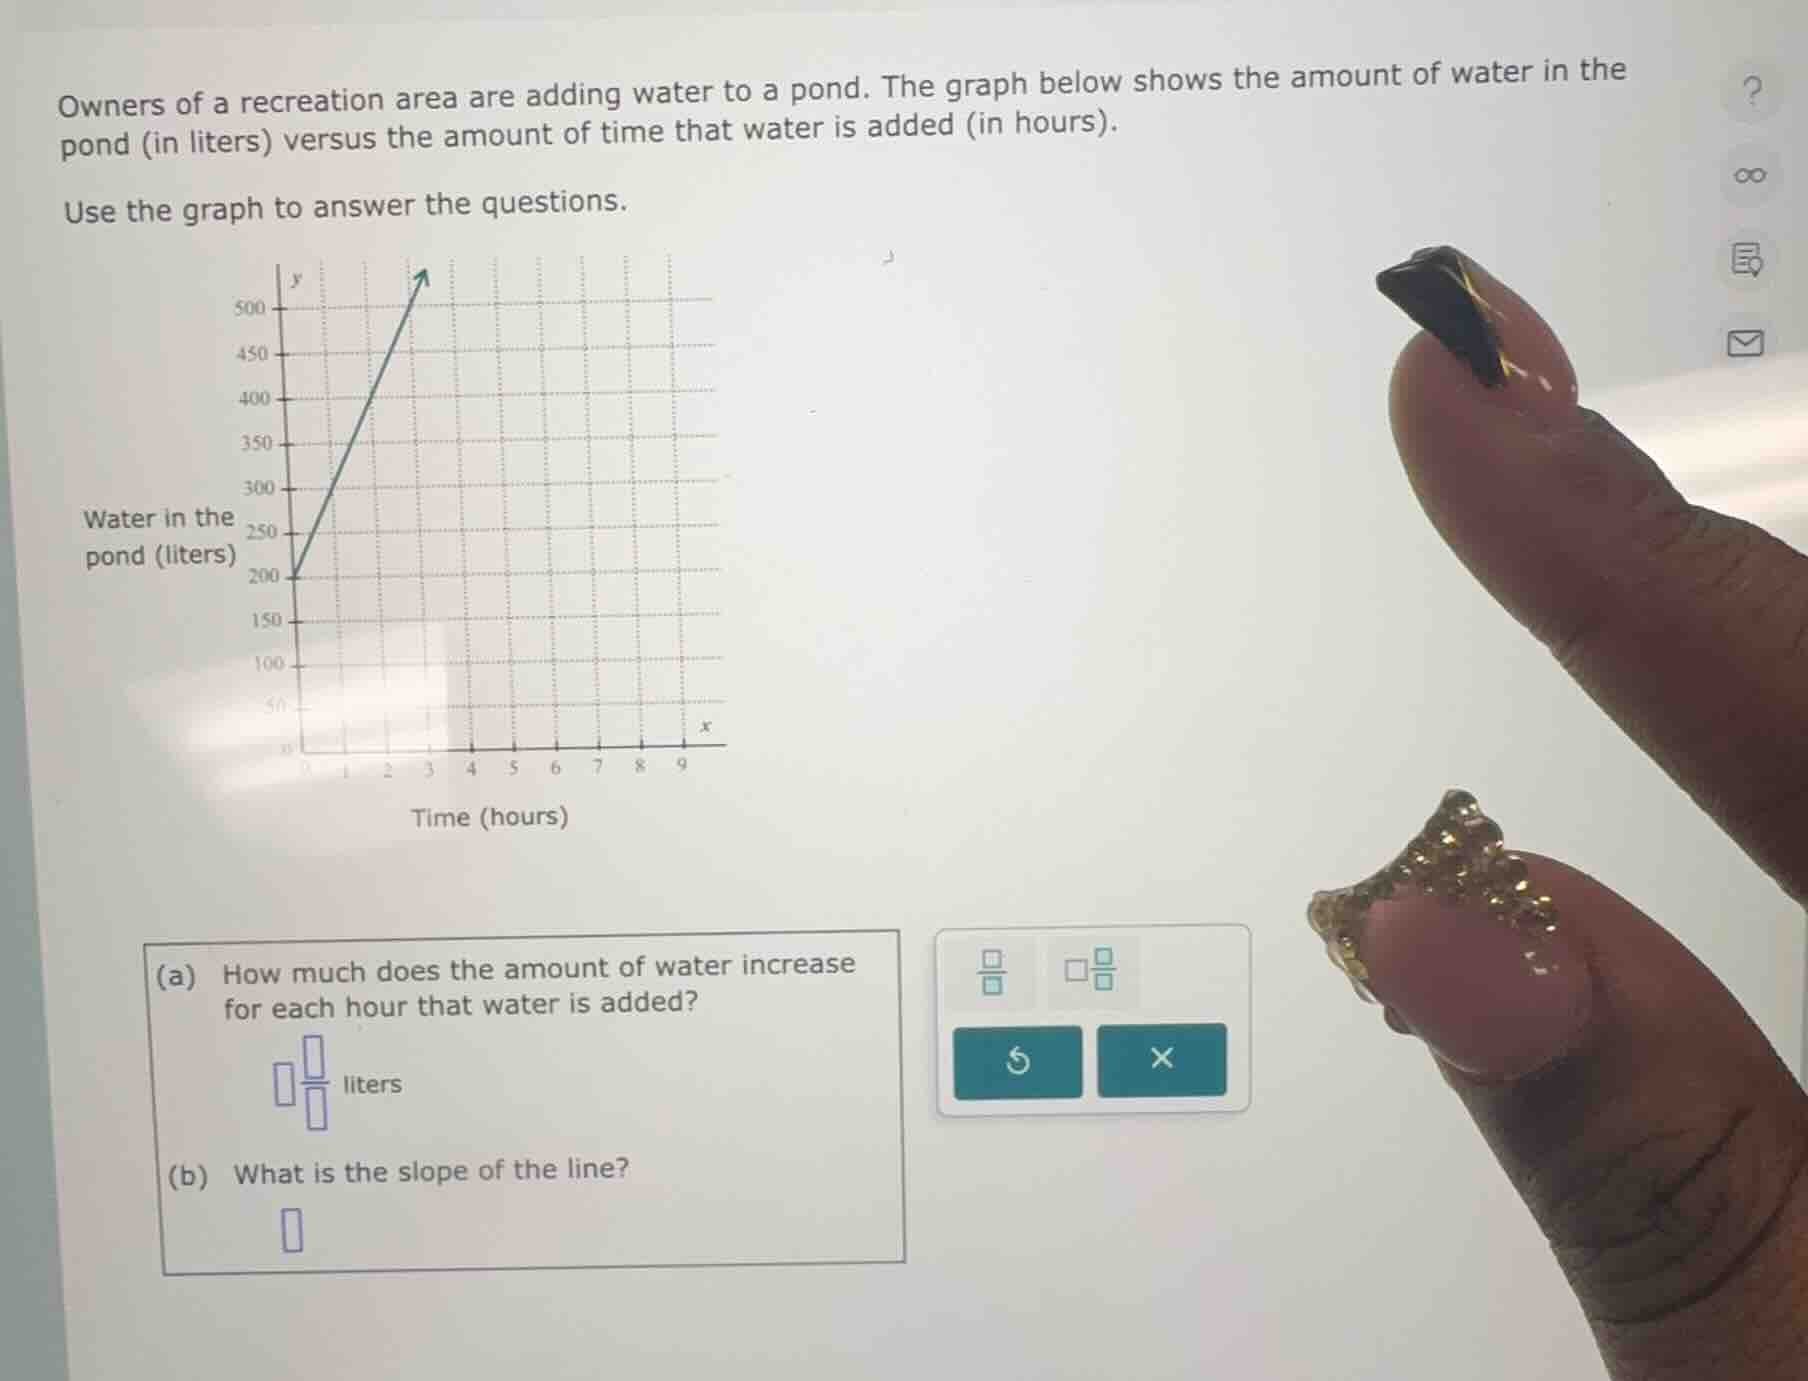
owners of a recreation area are adding water to a pond. the graph below shows the amount of water in the pond (in liters) versus the amount of time that water is added (in hours). use the graph to answer the questions. (a) how much does the amount of water increase for each hour that water is added? liters (b) what is the slope of the line?
Part (a)
Step1: Identify two points on the line
From the graph, we can see that when \( x = 0 \) (time = 0 hours), \( y = 200 \) liters (water in the pond). When \( x = 2 \) hours, \( y = 400 \) liters (we can also use other points, but these are easy to read).
Step2: Calculate the change in water and change in time
The change in water (\( \Delta y \)) is \( 400 - 200 = 200 \) liters. The change in time (\( \Delta x \)) is \( 2 - 0 = 2 \) hours.
Step3: Find the rate of increase per hour
To find the increase per hour, we divide the change in water by the change in time: \( \frac{\Delta y}{\Delta x}=\frac{200}{2} = 100 \) liters per hour.
Step1: Recall the formula for slope
The slope \( m \) of a line is given by \( m=\frac{\Delta y}{\Delta x} \), where \( \Delta y \) is the change in the \( y \)-variable and \( \Delta x \) is the change in the \( x \)-variable.
Step2: Use the points from part (a)
We already found that \( \Delta y = 200 \) liters and \( \Delta x = 2 \) hours. So, \( m=\frac{200}{2}=100 \).

Snap & solve any problem in the app
Get step-by-step solutions on Sovi AI
Photo-based solutions with guided steps
Explore more problems and detailed explanations
100