QUESTION IMAGE
Question
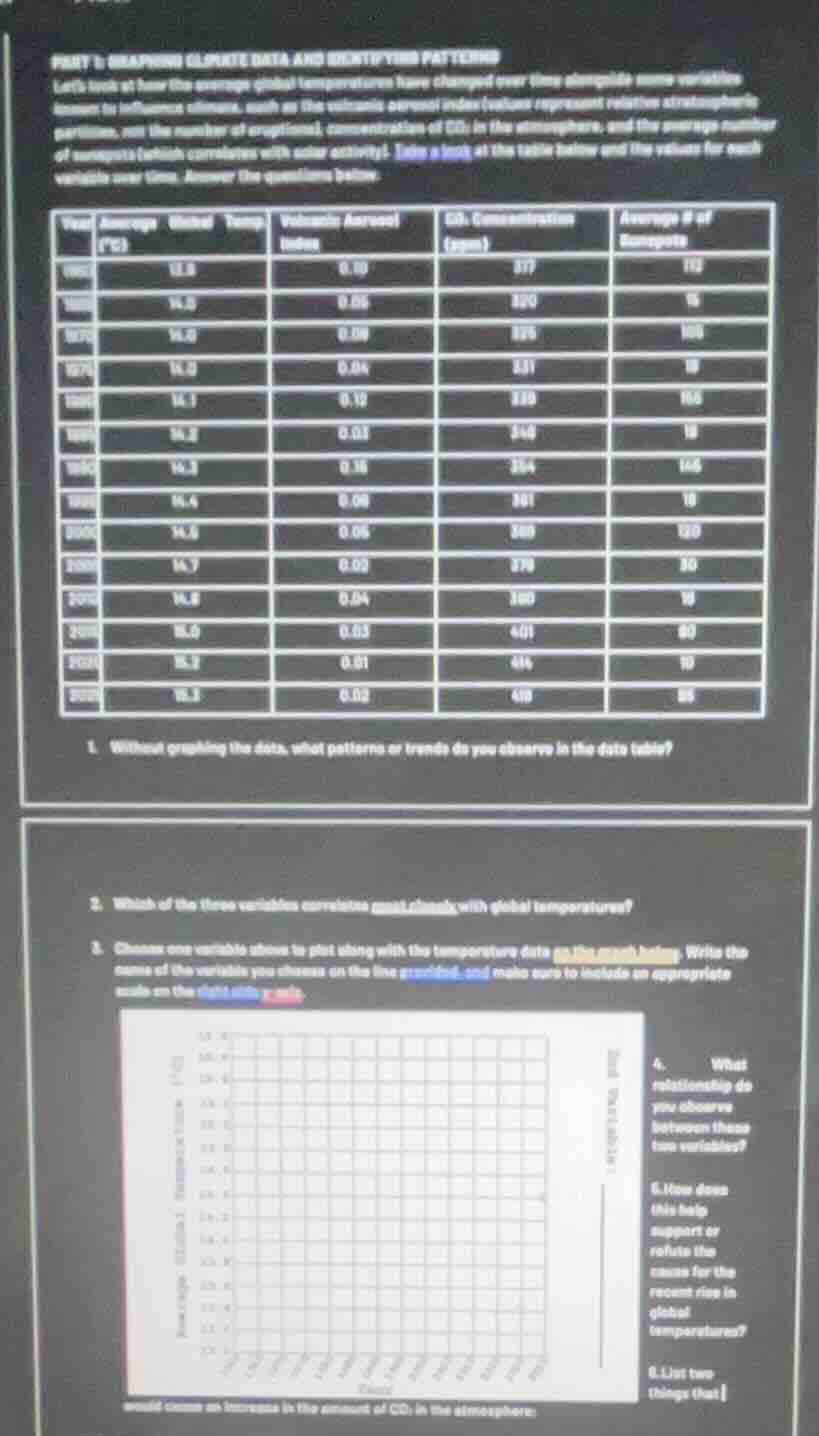
part 1: graphing climate data and identifying patterns
lets look at how the average global temperatures have changed over time alongside some variables known to influence climate, such as the volcanic aerosol index (which represents reactive stratospheric particles, not the number of eruptions), concentration of co₂ in the atmosphere, and the average number of sunspots (which correlates with solar activity). take a look at the table below and the values for each variable over time. answer the questions below
table with columns: year, average global temp (°c), volcanic aerosol index, co₂ concentration (ppm), average # of sunspots
- without graphing the data, what patterns or trends do you observe in the data table?
- which of the three variables correlates most closely with global temperature?
- choose one variable above to plot along with the temperature data on the graph below. write the name of the variable you choose on the line provided, and make sure to include an appropriate scale on the right - hand axis.
graph with axes, partially visible
- what relationship do you observe between these two variables?
- how does this help support or refute the cause for the recent rise in global temperatures?
- list two things that would cause an increase in the amount of co₂ in the atmosphere.
- For the first question, analyze each column's values over increasing years:
- Average global temp: Steadily rises from 13.8 to 16.3.
- Volcanic Aerosol Index: No clear upward/downward trend, fluctuates.
- CO₂ Concentration: Steadily rises from 317 to 410.
- Sunspots: Fluctuates with no long-term upward/downward trend.
- For the second question, compare trends: only CO₂ matches the steady upward trend of global temperatures, while the other two variables fluctuate randomly.
- For the third question, CO₂ is the best choice as it has a clear correlating trend with temperature; the y-axis for CO₂ can range from 300 to 420 ppm to cover all data points.
- For the fourth question, as CO₂ concentrations increase, average global temperatures also increase, showing a positive relationship.
- For the fifth question, the consistent positive relationship supports the idea that rising atmospheric CO₂ is a driver of the recent global temperature increase, as the trends align over time.
- For the sixth question, human activities like fossil fuel burning (for energy, transportation) and deforestation reduce carbon absorption, both increasing atmospheric CO₂.

Snap & solve any problem in the app
Get step-by-step solutions on Sovi AI
Photo-based solutions with guided steps
Explore more problems and detailed explanations
- Average global temperature and CO₂ concentration show a steady upward trend over time. Volcanic aerosol index and average number of sunspots fluctuate with no consistent long-term upward or downward trend.
- CO₂ concentration correlates most strongly with global temperatures.
- Variable chosen: CO₂ Concentration. Y-axis scale: 300 ppm to 420 ppm (in increments of 10 ppm)
- There is a positive relationship: as CO₂ concentration increases, average global temperature increases.
- This consistent positive trend supports the idea that the increase in atmospheric CO₂ is a contributing factor to the recent rise in global temperatures, as the two variables move in lockstep over the measured time period.
- 1. Burning of fossil fuels (coal, oil, gas) for electricity, heating, and transportation
- Deforestation, which reduces the number of trees that absorb CO₂ from the atmosphere