QUESTION IMAGE
Question
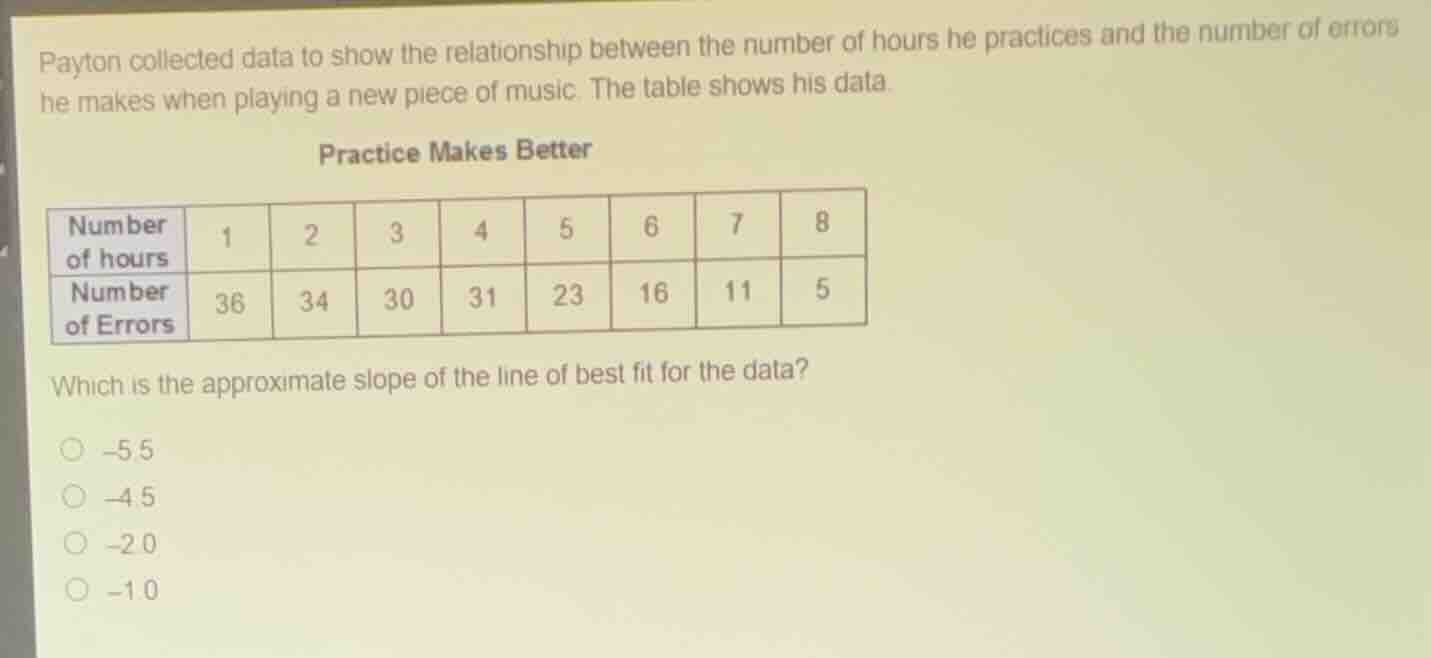
payton collected data to show the relationship between the number of hours he practices and the number of errors he makes when playing a new piece of music. the table shows his data. practice makes better table with number of hours (1,2,3,4,5,6,7,8) and number of errors (36,34,30,31,23,16,11,5) which is the approximate slope of the line of best fit for the data? -5.5 -4.5 -2.0 -1.0
Step1: Identify two points for slope calculation
We can use the first and last points for approximation. Let \( (x_1, y_1)=(1, 36) \) and \( (x_2, y_2)=(8, 5) \).
Step2: Apply slope formula
The slope formula is \( m = \frac{y_2 - y_1}{x_2 - x_1} \).
Substitute the values: \( m=\frac{5 - 36}{8 - 1}=\frac{- 31}{7}\approx - 4.43\approx - 4.5 \).

Snap & solve any problem in the app
Get step-by-step solutions on Sovi AI
Photo-based solutions with guided steps
Explore more problems and detailed explanations
-4.5