QUESTION IMAGE
Question
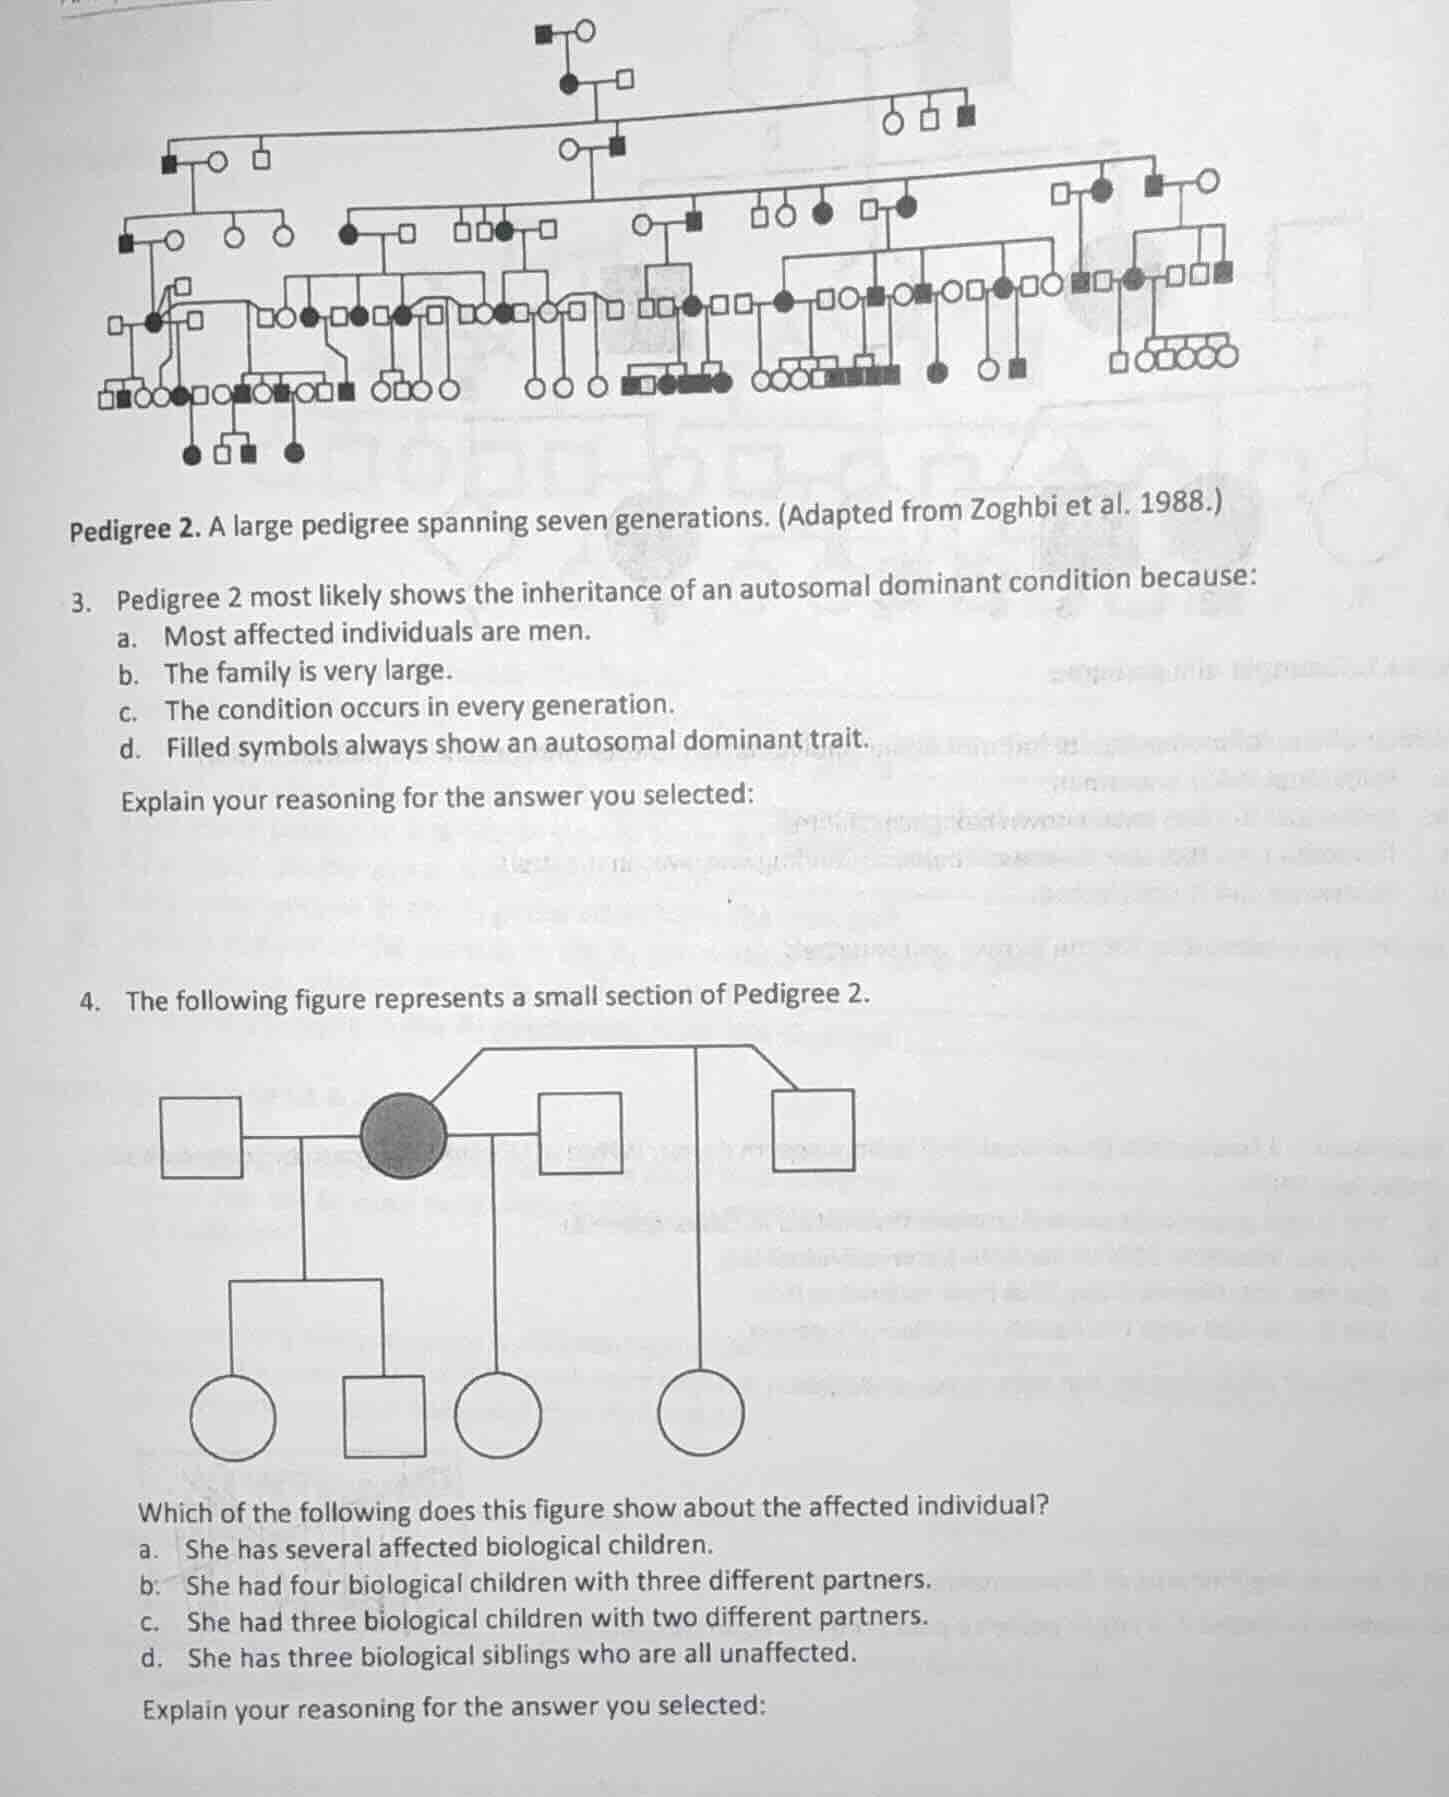
pedigree 2. a large pedigree spanning seven generations. (adapted from zoghbi et al. 1988.)
- pedigree 2 most likely shows the inheritance of an autosomal dominant condition because:
a. most affected individuals are men.
b. the family is very large.
c. the condition occurs in every generation.
d. filled symbols always show an autosomal dominant trait.
explain your reasoning for the answer you selected:
- the following figure represents a small section of pedigree 2.
image of a small pedigree section
which of the following does this figure show about the affected individual?
a. she has several affected biological children.
b. she had four biological children with three different partners.
c. she had three biological children with two different partners.
d. she has three biological siblings who are all unaffected.
explain your reasoning for the answer you selected:
Question 3
- Option a: Autosomal dominant traits affect males and females equally, so "most affected are men" is not a sign of autosomal dominant.
- Option b: Family size doesn't determine inheritance pattern.
- Option c: Autosomal dominant traits are typically present in every generation because an affected individual (with one dominant allele) has a 50% chance of passing it on, so the trait appears continuously across generations.
- Option d: Filled symbols just represent affected individuals; they don’t always mean autosomal dominant (could be recessive, X - linked, etc.).
- Option a: The children’s symbols are unfilled, so they are unaffected.
- Option b: The pedigree shows the affected female has three children (two from one partner, one from another? No, looking at the lines: she has three children (two circles, one square) with one partner (the first square) and one child (circle) with another? Wait, no—count the children: from the first partner (left square), she has two children (circle and square). From the middle square, she has one circle. From the right square, one circle? Wait, no, the figure: the affected female (filled circle) has three children with the first partner (two children: circle and square), one child with the middle partner (circle), and one child with the right partner (circle)? Wait, no, the lines: the first partner (left square) connects to her and has two children (circle, square). The middle square connects to her and has one circle. The right square connects to her and has one circle? Wait, no, the total children: let's count the offspring. She has three children? No, looking at the figure: the affected female has three children with the first partner (two children: circle and square) and one child with the middle partner (circle) and one child with the right partner (circle)? Wait, no, the correct count: the affected female has three children with two different partners? Wait, no—each horizontal line from a partner to her represents a mating. The first partner (left square) has a line to her and two children. The middle square has a line to her and one child. The right square has a line to her and one child? Wait, no, the figure: the affected female (filled circle) has three children? Wait, no, the offspring: below her, there are three children? No, let's look again. The affected female has three children: two from one partner (the left square: a circle and a square) and one from the middle square (circle), and one from the right square (circle)? Wait, no, the lines: the first partner (left square) → two children. Middle square → one child. Right square → one child. Wait, that's four children? No, maybe I miscounted. Wait, the options: option b says four children with three partners, option c says three with two. Wait, looking at the figure: the affected female has three children? No, the figure shows: from the first partner (left square), two children (circle, square). From the middle square, one circle. From the right square, one circle. Wait, that's four children (2 + 1+1) with three different partners? No, maybe the lines: the first partner (left square) has a line to her and two children. The middle square has a line to her and one child. The right square has a line to her and one child. So total four children with three partners? But option b says "four biological children with three different partners". Wait, but let's check the siblings: option d: her siblings—above her, there are three squares (unfilled), so three siblings, all unaffected. Wait, no—above her, the lines: the top line connects to three squares (her siblings) and her (filled circle). So she has three biological siblings (the three squares) who are all unaffected (unfilled). Wait, that's option d. Wait, I made a mistake earlier. Let's re - examine:
The figure: the affected female (filled circle) has three siblings (the three squares above her, all unfilled) → so option d: "She has three biological siblings who are all unaffected."
- Let's re - analyze each option:
- Option a: Children are unfilled (unaffected), so wrong.
- Option b: If we count the children, from three partners, how many child…

Snap & solve any problem in the app
Get step-by-step solutions on Sovi AI
Photo-based solutions with guided steps
Explore more problems and detailed explanations
c. The condition occurs in every generation.