QUESTION IMAGE
Question
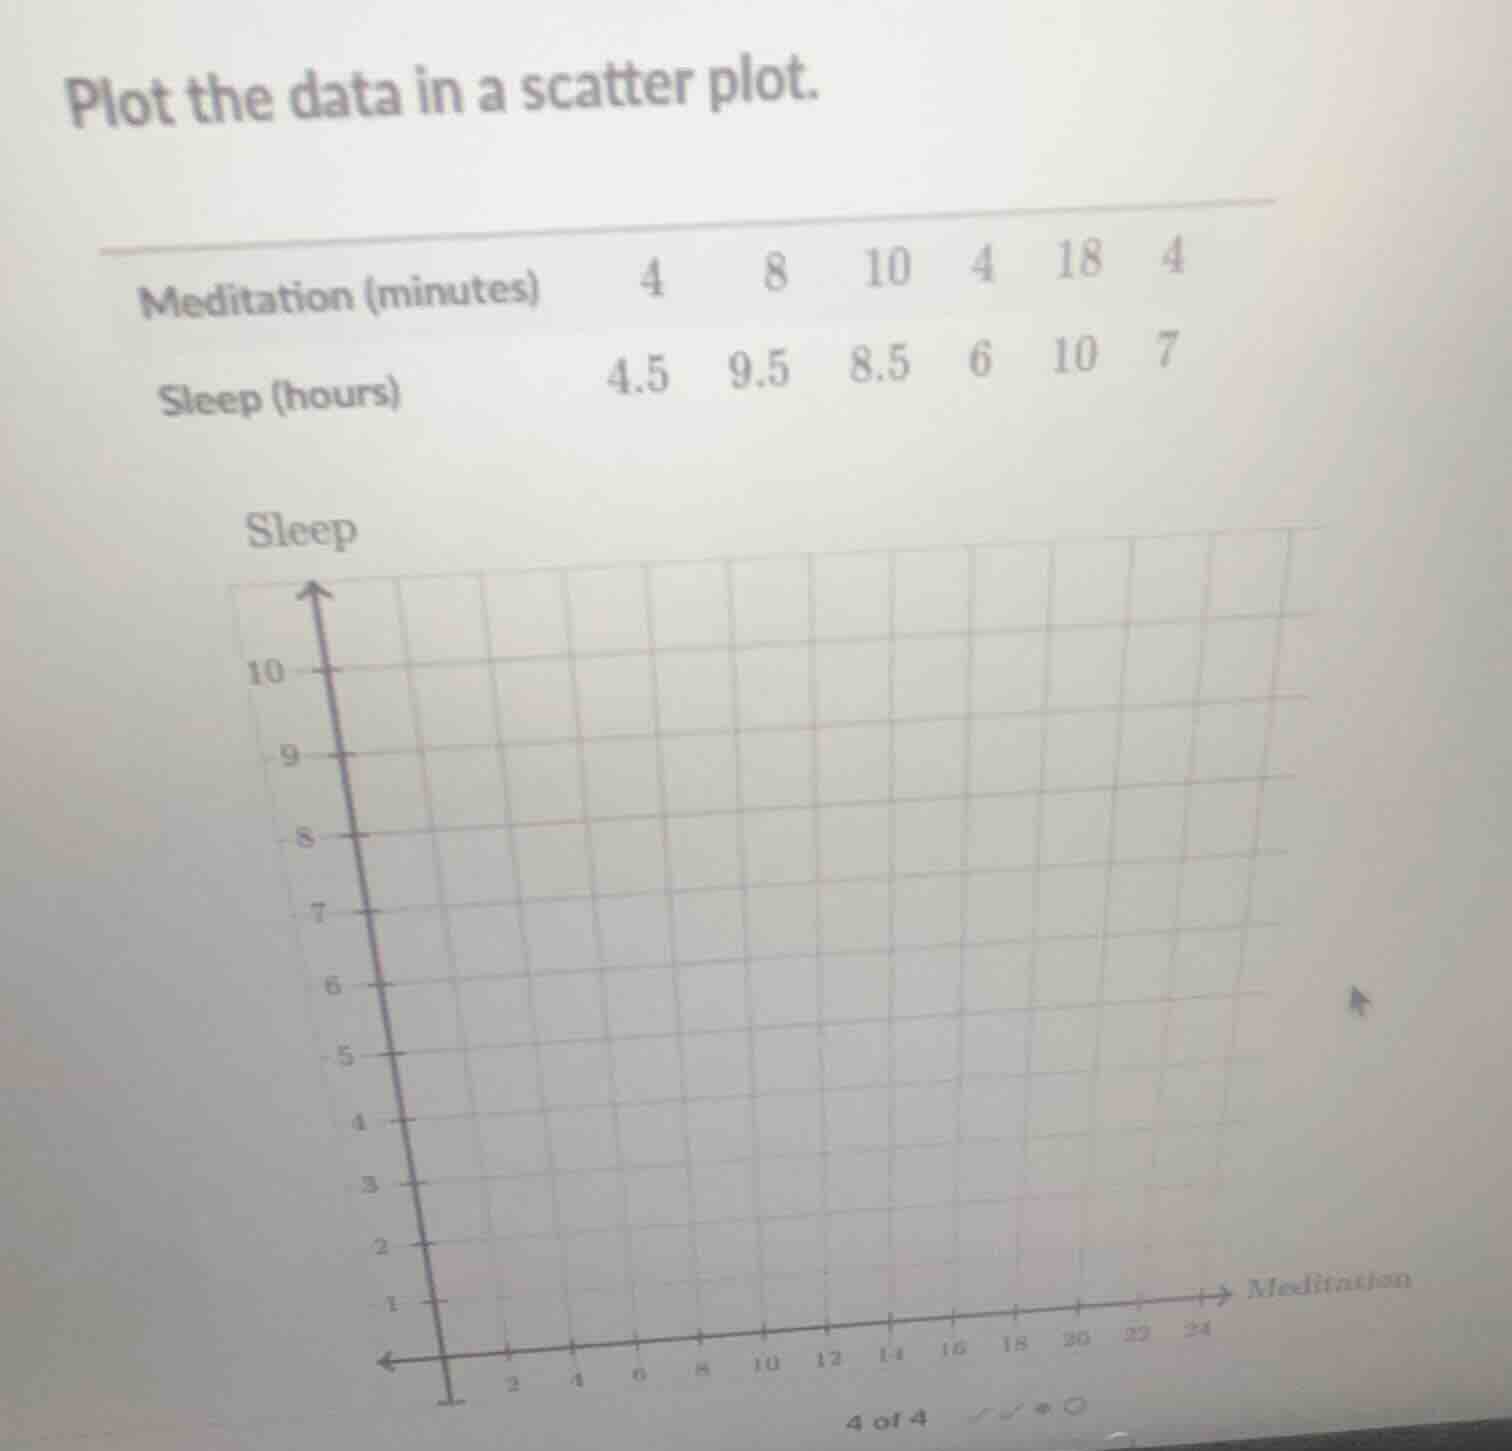
plot the data in a scatter plot.
meditation (minutes) 4 8 10 4 18 4
sleep (hours) 4.5 9.5 8.5 6 10 7
Step1: Identify data pairs
Pairs: $(4, 4.5), (8, 9.5), (10, 8.5), (4, 6), (18, 10), (4, 7)$
Step2: Map x (Meditation) to x-axis
Align x-values to bottom axis ticks.
Step3: Map y (Sleep) to y-axis
Align y-values to left axis ticks.
Step4: Plot each data point
Mark each pair on the grid.

Snap & solve any problem in the app
Get step-by-step solutions on Sovi AI
Photo-based solutions with guided steps
Explore more problems and detailed explanations
The scatter plot will have the following points plotted:
- (4, 4.5): 4 on x-axis, 4.5 on y-axis
- (8, 9.5): 8 on x-axis, 9.5 on y-axis
- (10, 8.5): 10 on x-axis, 8.5 on y-axis
- (4, 6): 4 on x-axis, 6 on y-axis
- (18, 10): 18 on x-axis, 10 on y-axis
- (4, 7): 4 on x-axis, 7 on y-axis
Visual representation:
| Meditation (x) | Sleep (y) | Plot Position Description |
|---|---|---|
| 8 | 9.5 | Halfway between 9 and 10 on y-axis, at 8 on x-axis |
| 10 | 8.5 | Halfway between 8 and 9 on y-axis, at 10 on x-axis |
| 4 | 6 | At 6 on y-axis, at 4 on x-axis |
| 18 | 10 | At 10 on y-axis, at 18 on x-axis |
| 4 | 7 | At 7 on y-axis, at 4 on x-axis |