QUESTION IMAGE
Question
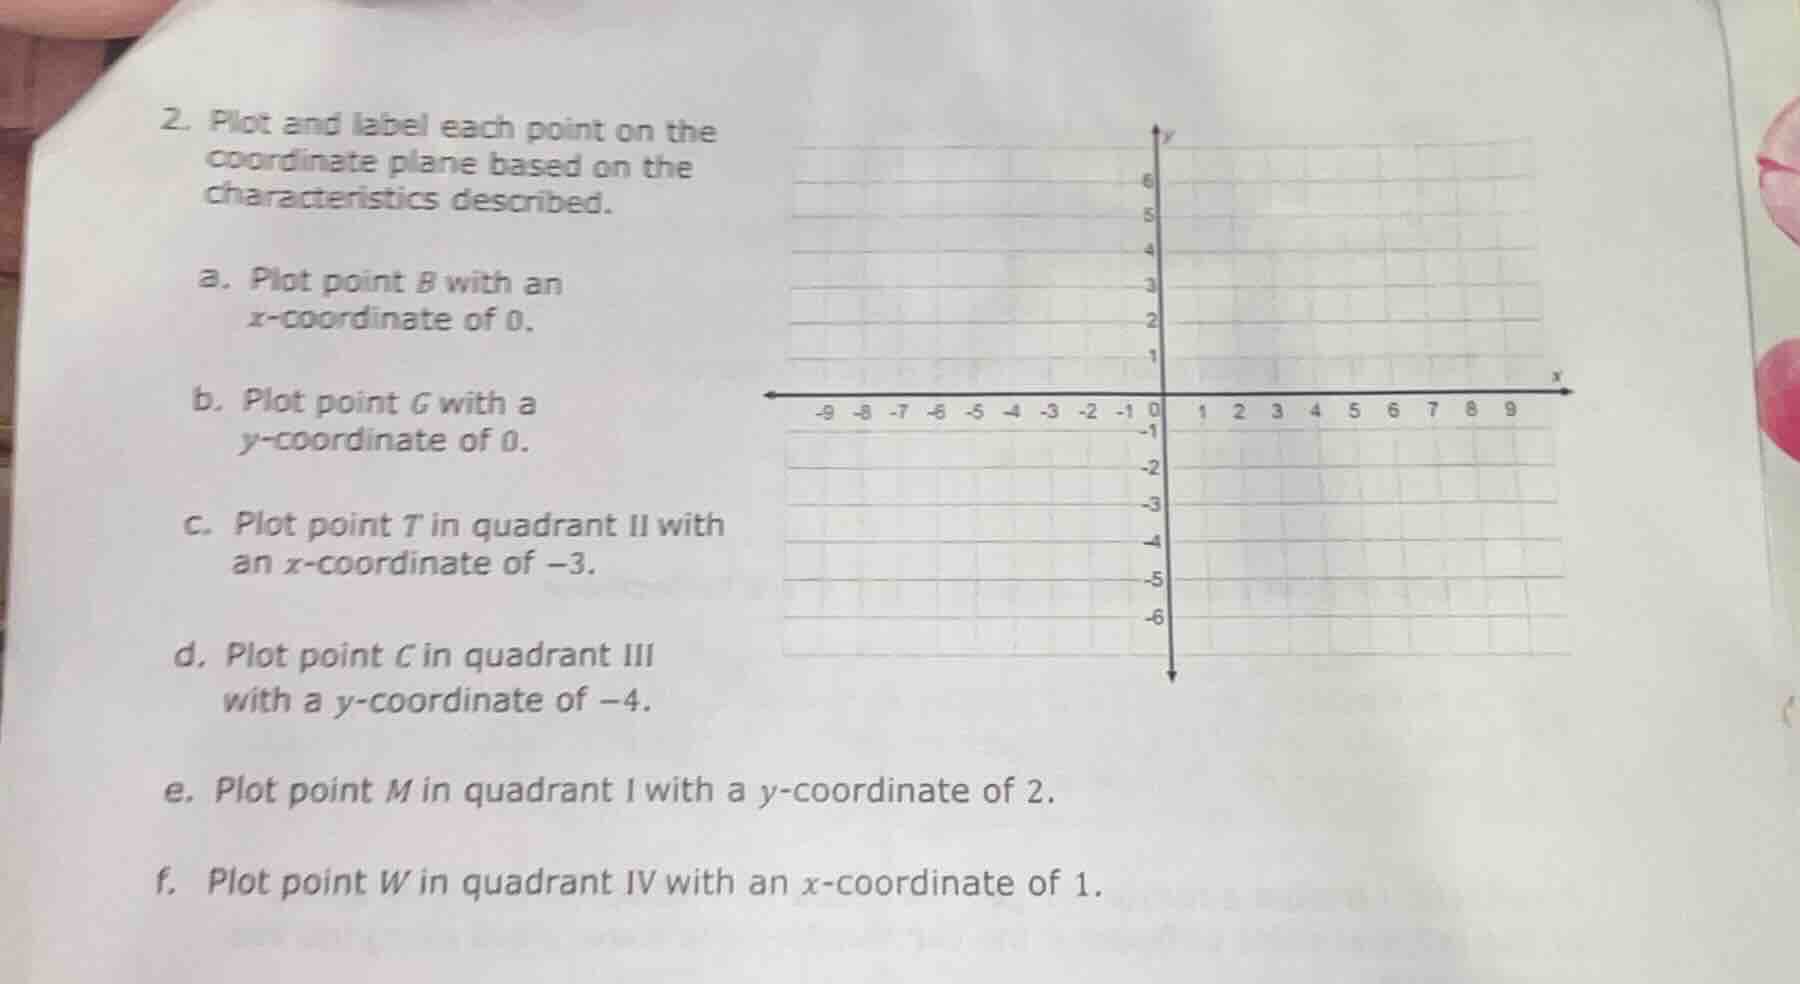
- plot and label each point on the coordinate plane based on the characteristics described.
a. plot point b with an x-coordinate of 0.
b. plot point g with a y-coordinate of 0.
c. plot point t in quadrant ii with an x-coordinate of −3.
d. plot point c in quadrant iii with a y-coordinate of −4.
e. plot point m in quadrant i with a y-coordinate of 2.
f. plot point w in quadrant iv with an x-coordinate of 1.
Step1: Analyze Point B
Point B has \( x = 0 \), so it lies on the y - axis. We can choose any \( y \) - coordinate (e.g., \( y = 3 \)), so the coordinates of B can be \( (0,3) \). To plot it, find \( x = 0 \) (the y - axis) and move 3 units up (or any non - zero \( y \) as long as \( x = 0 \)).
Step2: Analyze Point G
Point G has \( y = 0 \), so it lies on the x - axis. We can choose any \( x \) - coordinate (e.g., \( x = 2 \)), so the coordinates of G can be \( (2,0) \). To plot it, find \( y = 0 \) (the x - axis) and move 2 units to the right (or any non - zero \( x \) as long as \( y = 0 \)).
Step3: Analyze Point T
In quadrant II, \( x<0 \) and \( y > 0 \). Given \( x=-3 \), we can choose \( y = 4 \) (any positive \( y \)). So the coordinates of T are \( (-3,4) \). To plot it, move 3 units left from the origin (since \( x=-3 \)) and 4 units up (since \( y = 4 \)).
Step4: Analyze Point C
In quadrant III, \( x<0 \) and \( y<0 \). Given \( y = - 4 \), we can choose \( x=-2 \) (any negative \( x \)). So the coordinates of C are \( (-2,-4) \). To plot it, move 2 units left from the origin (since \( x=-2 \)) and 4 units down (since \( y=-4 \)).
Step5: Analyze Point M
In quadrant I, \( x>0 \) and \( y > 0 \). Given \( y = 2 \), we can choose \( x = 3 \) (any positive \( x \)). So the coordinates of M are \( (3,2) \). To plot it, move 3 units right from the origin (since \( x = 3 \)) and 2 units up (since \( y = 2 \)).
Step6: Analyze Point W
In quadrant IV, \( x>0 \) and \( y<0 \). Given \( x = 1 \), we can choose \( y=-3 \) (any negative \( y \)). So the coordinates of W are \( (1,-3) \). To plot it, move 1 unit right from the origin (since \( x = 1 \)) and 3 units down (since \( y=-3 \)).
(Note: The actual plotting is done on the coordinate plane. For example:
- Point B: On the y - axis (x = 0), say at (0, 3).
- Point G: On the x - axis (y = 0), say at (2, 0).
- Point T: At (-3, 4) (quadrant II, x=-3, y>0).
- Point C: At (-2, - 4) (quadrant III, y=-4, x<0).
- Point M: At (3, 2) (quadrant I, y = 2, x>0).
- Point W: At (1, - 3) (quadrant IV, x = 1, y<0).)

Snap & solve any problem in the app
Get step-by-step solutions on Sovi AI
Photo-based solutions with guided steps
Explore more problems and detailed explanations
- Point B: Plotted on the y - axis (e.g., \((0, 3)\))
- Point G: Plotted on the x - axis (e.g., \((2, 0)\))
- Point T: Plotted at \((-3, 4)\) (quadrant II)
- Point C: Plotted at \((-2, - 4)\) (quadrant III)
- Point M: Plotted at \((3, 2)\) (quadrant I)
- Point W: Plotted at \((1, - 3)\) (quadrant IV)