QUESTION IMAGE
Question
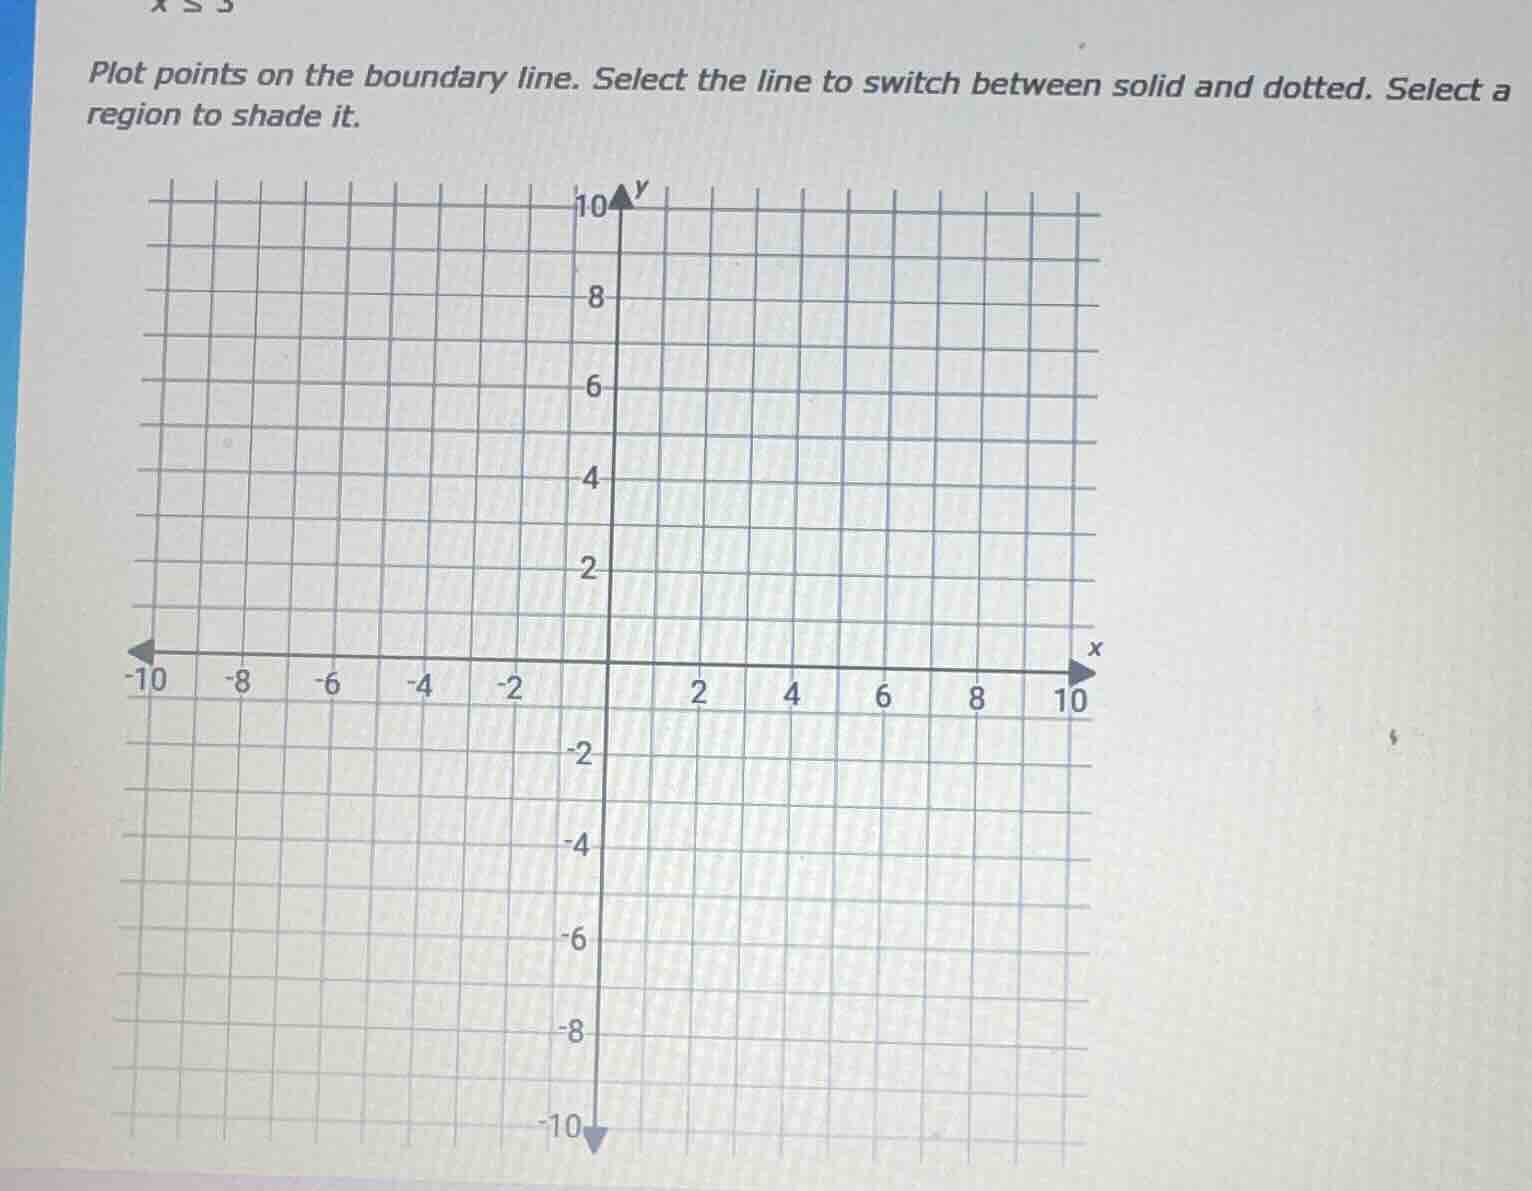
plot points on the boundary line. select the line to switch between solid and dotted. select a region to shade it.
Step1: Identify the boundary line
The inequality is \( x \leq 3 \). This is a vertical line where \( x = 3 \). Since the inequality is "less than or equal to", the boundary line should be solid (because the points on the line are included in the solution set).
Step2: Plot the boundary line
To plot \( x = 3 \), we draw a vertical line passing through \( x = 3 \) on the x - axis. This line will intersect the x - axis at \( (3,0) \), and we can also plot other points on this line, such as \( (3,1) \), \( (3, - 1) \), \( (3,2) \), etc., to define the vertical line.
Step3: Determine the region to shade
For the inequality \( x\leq3 \), we need to shade the region where \( x \) - values are less than or equal to 3. This region is to the left of the line \( x = 3 \) (including the line itself). So we shade all the area on and to the left of the vertical line \( x = 3 \).

Snap & solve any problem in the app
Get step-by-step solutions on Sovi AI
Photo-based solutions with guided steps
Explore more problems and detailed explanations
- Draw a solid vertical line \( x = 3 \) (passing through points like \( (3,0) \), \( (3,1) \), \( (3, - 1) \), etc.).
- Shade the region to the left of the line \( x = 3 \) (including the line).