QUESTION IMAGE
Question
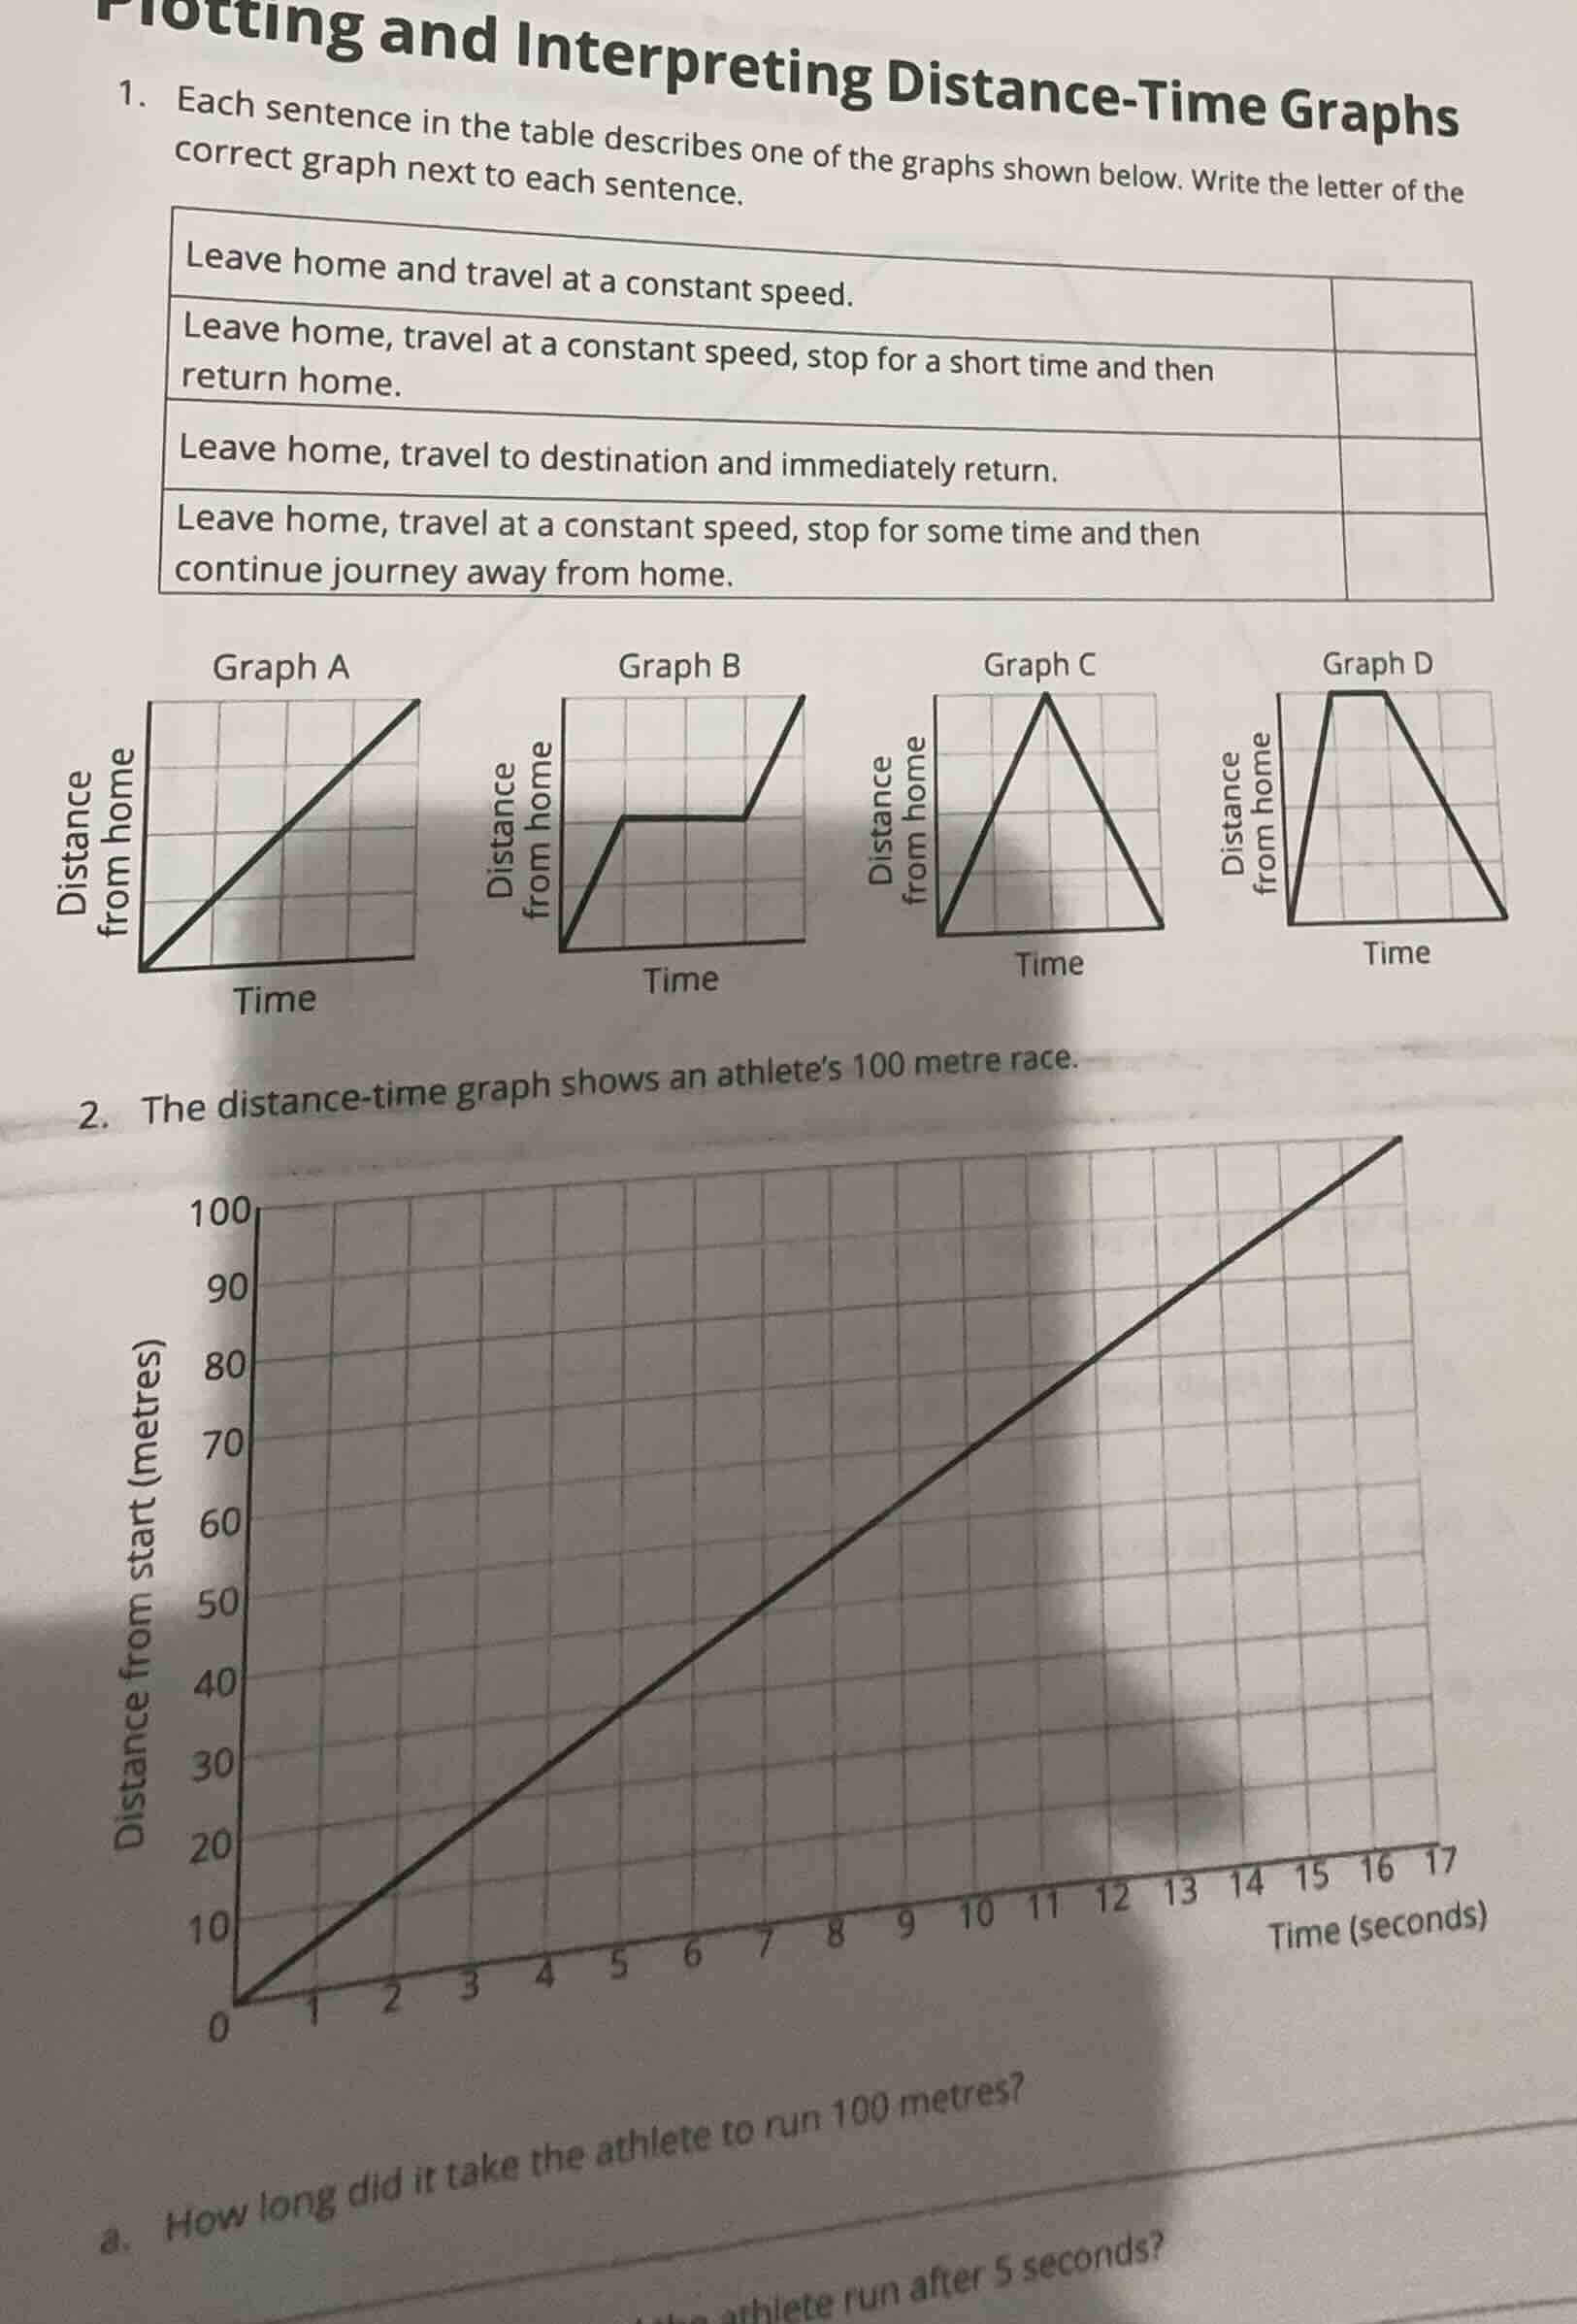
plotting and interpreting distance - time graphs
- each sentence in the table describes one of the graphs shown below. write the letter of the correct graph next to each sentence.
| leave home and travel at a constant speed. | |
| leave home, travel at a constant speed, stop for a short time and then return home. | |
| leave home, travel to destination and immediately return. | |
| leave home, travel at a constant speed, stop for some time and then continue journey away from home. |
graph a: distance from home vs time (a straight line from origin increasing)
graph b: distance from home vs time (a line increasing, then flat, then increasing)
graph c: distance from home vs time (a triangle - shaped graph, increasing then decreasing)
graph d: distance from home vs time (a graph increasing, flat, then decreasing)
- the distance - time graph shows an athlete’s 100 metre race.
(graph: distance from start (metres) on y - axis, time (seconds) on x - axis, a straight line from (0,0) to (16,100) approximately)
a. how long did it take the athlete to run 100 metres?
athlete run after 5 seconds? (incomplete sentence)
Problem 1: Matching Sentences to Graphs
1. "Leave home and travel at a constant speed."
- Explanation: A constant speed on a distance - time graph is represented by a straight line with a positive slope (since distance from home is increasing with time). Graph A has a straight line from the origin (starting at home, distance 0) with a constant slope, so it represents constant speed away from home.
- Answer: A
2. "Leave home, travel at a constant speed, stop for a short time and then return home."
- Explanation: First, there is an increase in distance (constant speed), then a horizontal line (stop, distance doesn't change with time), then a decrease in distance back to 0 (returning home). Graph D has an increase, a horizontal segment (stop), and then a decrease back to the origin.
- Answer: D
3. "Leave home, travel to destination and immediately return."
- Explanation: The distance increases to a maximum (reaching destination) and then immediately decreases back to 0 (returning home) with no stop in between. Graph C has a triangular shape, increasing to a peak and then decreasing back to 0, representing going and immediately coming back.
- Answer: C
4. "Leave home, travel at a constant speed, stop for some time and then continue journey away from home."
- Explanation: First, distance increases (constant speed), then a horizontal line (stop), then another increase in distance (continuing journey away from home). Graph B has an increase, a horizontal segment (stop), and then another increase.
- Answer: B
Problem 2a: Time to Run 100 Metres
Step 1: Analyze the Graph
The graph is a distance - time graph for an athlete's 100 - metre race. The y - axis is distance from start (in metres) and the x - axis is time (in seconds). We need to find the value of x (time) when y (distance) is 100 metres.
Step 2: Find the Time at 100 Metres
Looking at the graph, when the distance (y - value) is 100 metres, we look at the corresponding x - value (time). From the grid, we can see that when distance = 100 metres, the time is 16 seconds (by following the line to the x - axis or looking at the grid intersections).

Snap & solve any problem in the app
Get step-by-step solutions on Sovi AI
Photo-based solutions with guided steps
Explore more problems and detailed explanations
It took the athlete 16 seconds to run 100 metres.