QUESTION IMAGE
Question
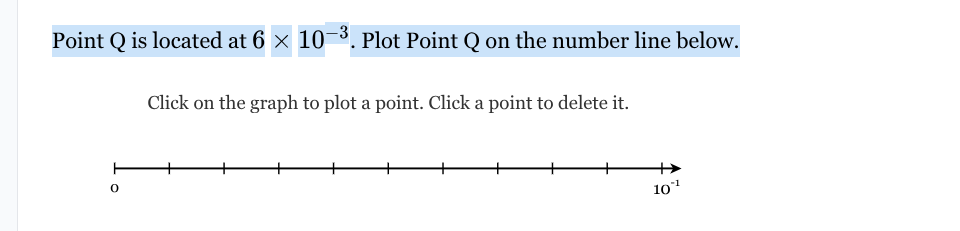
point q is located at $6 \times 10^{-3}$. plot point q on the number line below. click on the graph to plot a point. click a point to delete it. 0 $10^{-1}$
Step1: Convert scientific notation to decimal
We know that \(10^{-3}=\frac{1}{1000} = 0.001\), so \(6\times10^{-3}=6\times0.001 = 0.006\). Also, \(10^{-1}=0.1\).
Step2: Determine the scale of the number line
The number line goes from \(0\) to \(10^{-1}=0.1\). Let's find the length between each tick mark. The distance from \(0\) to \(0.1\) is \(0.1\), and if we count the number of tick marks between \(0\) and \(0.1\), we can see that from \(0\) to \(0.1\) there are \(10\) intervals (since \(0.1\div0.01 = 10\), assuming each tick mark is \(0.01\) apart? Wait, no, let's check the exponent. Wait, \(10^{-3}\) is \(0.001\), \(10^{-2}=0.01\), \(10^{-1}=0.1\). Wait, the number of intervals between \(0\) and \(10^{-1}\): let's see, the first mark after \(0\) is \(10^{-3}\)? No, wait, the number line has marks. Let's think in terms of powers of \(10\). The left end is \(0\) (which is \(0\times10^{0}\)) and the right end is \(10^{-1}\). Let's find the value of each tick. The distance from \(0\) to \(10^{-1}\) is \(10^{-1}-0 = 10^{-1}\). If we look at the number of tick marks between \(0\) and \(10^{-1}\), let's count: from \(0\) to the first tick, second, ..., up to the tenth tick which is \(10^{-1}\). So each tick represents \(10^{-2}\)? Wait, no, \(10^{-1}\) divided by \(10\) is \(10^{-2}\), but our point is \(6\times10^{-3}=0.006\), and \(10^{-2}=0.01 = 10\times10^{-3}\). Wait, maybe the scale is in terms of \(10^{-3}\). So from \(0\) to \(10^{-1}\) (which is \(100\times10^{-3}\)), so if there are \(100\) intervals of \(10^{-3}\) between \(0\) and \(10^{-1}\)? No, the number of tick marks: looking at the number line, from \(0\) to \(10^{-1}\), how many ticks? Let's see the original number line: the left end is \(0\) (marked as \(0\)) and the right end is \(10^{-1}\). The number of ticks between \(0\) and \(10^{-1}\): let's count the small lines. From \(0\) to \(10^{-1}\), there are \(10\) small intervals? Wait, no, the user's number line has \(0\) on the left, then several ticks, then \(10^{-1}\) on the right. Let's calculate the position of \(6\times10^{-3}\) relative to \(0\) and \(10^{-1}\). Since \(10^{-1}=0.1 = 100\times10^{-3}\), so the number line from \(0\) to \(0.1\) is divided into, say, \(10\) equal parts? Wait, no, \(0.1\) divided by \(10\) is \(0.01\), but our point is \(0.006\), which is \(6\times10^{-3}\). Wait, maybe the scale is such that each tick is \(10^{-3}\). So from \(0\) (which is \(0\times10^{-3}\)) to \(10^{-1}=100\times10^{-3}\), so the tick marks are at \(1\times10^{-3},2\times10^{-3},\cdots,100\times10^{-3}\). So the sixth tick mark (since our point is \(6\times10^{-3}\)) would be at \(6\times10^{-3}\). So we need to plot the point at the position corresponding to \(6\times10^{-3}\) on the number line, which is \(6\) units to the right of \(0\) if each unit is \(10^{-3}\).

Snap & solve any problem in the app
Get step-by-step solutions on Sovi AI
Photo-based solutions with guided steps
Explore more problems and detailed explanations
To plot point \(Q\) at \(6\times10^{-3}\), we first convert it to decimal (\(0.006\)). The number line ranges from \(0\) to \(0.1\) (\(10^{-1}\)). Since \(6\times10^{-3}=0.006\), we find the position on the number line that is \(6\) thousandths from \(0\). If the number line has tick marks representing increments of \(10^{-3}\) (or \(0.001\)) between \(0\) and \(0.1\) (which is \(100\times10^{-3}\)), we plot the point \(6\) ticks to the right of \(0\) (each tick being \(10^{-3}\) or \(0.001\) in value). So we click on the position corresponding to \(0.006\) on the number line.