QUESTION IMAGE
Question
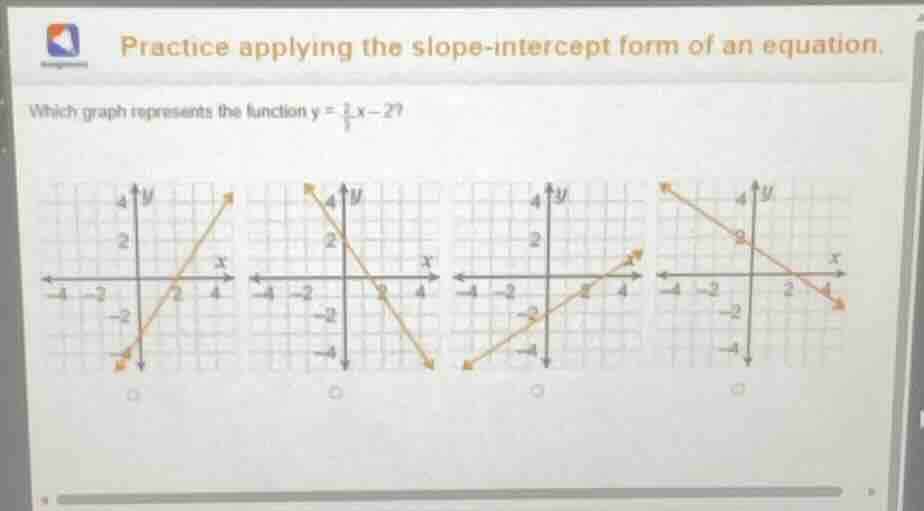
practice applying the slope - intercept form of an equation. which graph represents the function ( y=\frac{1}{1}x - 2)?
Step1: Identify slope and y-intercept
The slope-intercept form is $y=mx+b$, where $m$ is slope, $b$ is y-intercept. For $y=\frac{1}{1}x-2$, $m=1$, $b=-2$.
Step2: Analyze y-intercept
A y-intercept of $-2$ means the line crosses the y-axis at $(0, -2)$.
Step3: Analyze slope
A slope of $1$ ($\frac{\text{rise}}{\text{run}}=\frac{1}{1}$) means for every 1 unit right, the line rises 1 unit.
Step4: Match to graphs
Only the third graph crosses the y-axis at $(0, -2)$ and has a positive upward slope.

Snap & solve any problem in the app
Get step-by-step solutions on Sovi AI
Photo-based solutions with guided steps
Explore more problems and detailed explanations
The third graph (bottom-left option, crossing y-axis at (0,-2) with positive slope)