QUESTION IMAGE
Question
practice interpreting a linear function
study the example showing how to interpret a linear function. then solve problems 1–4.
example
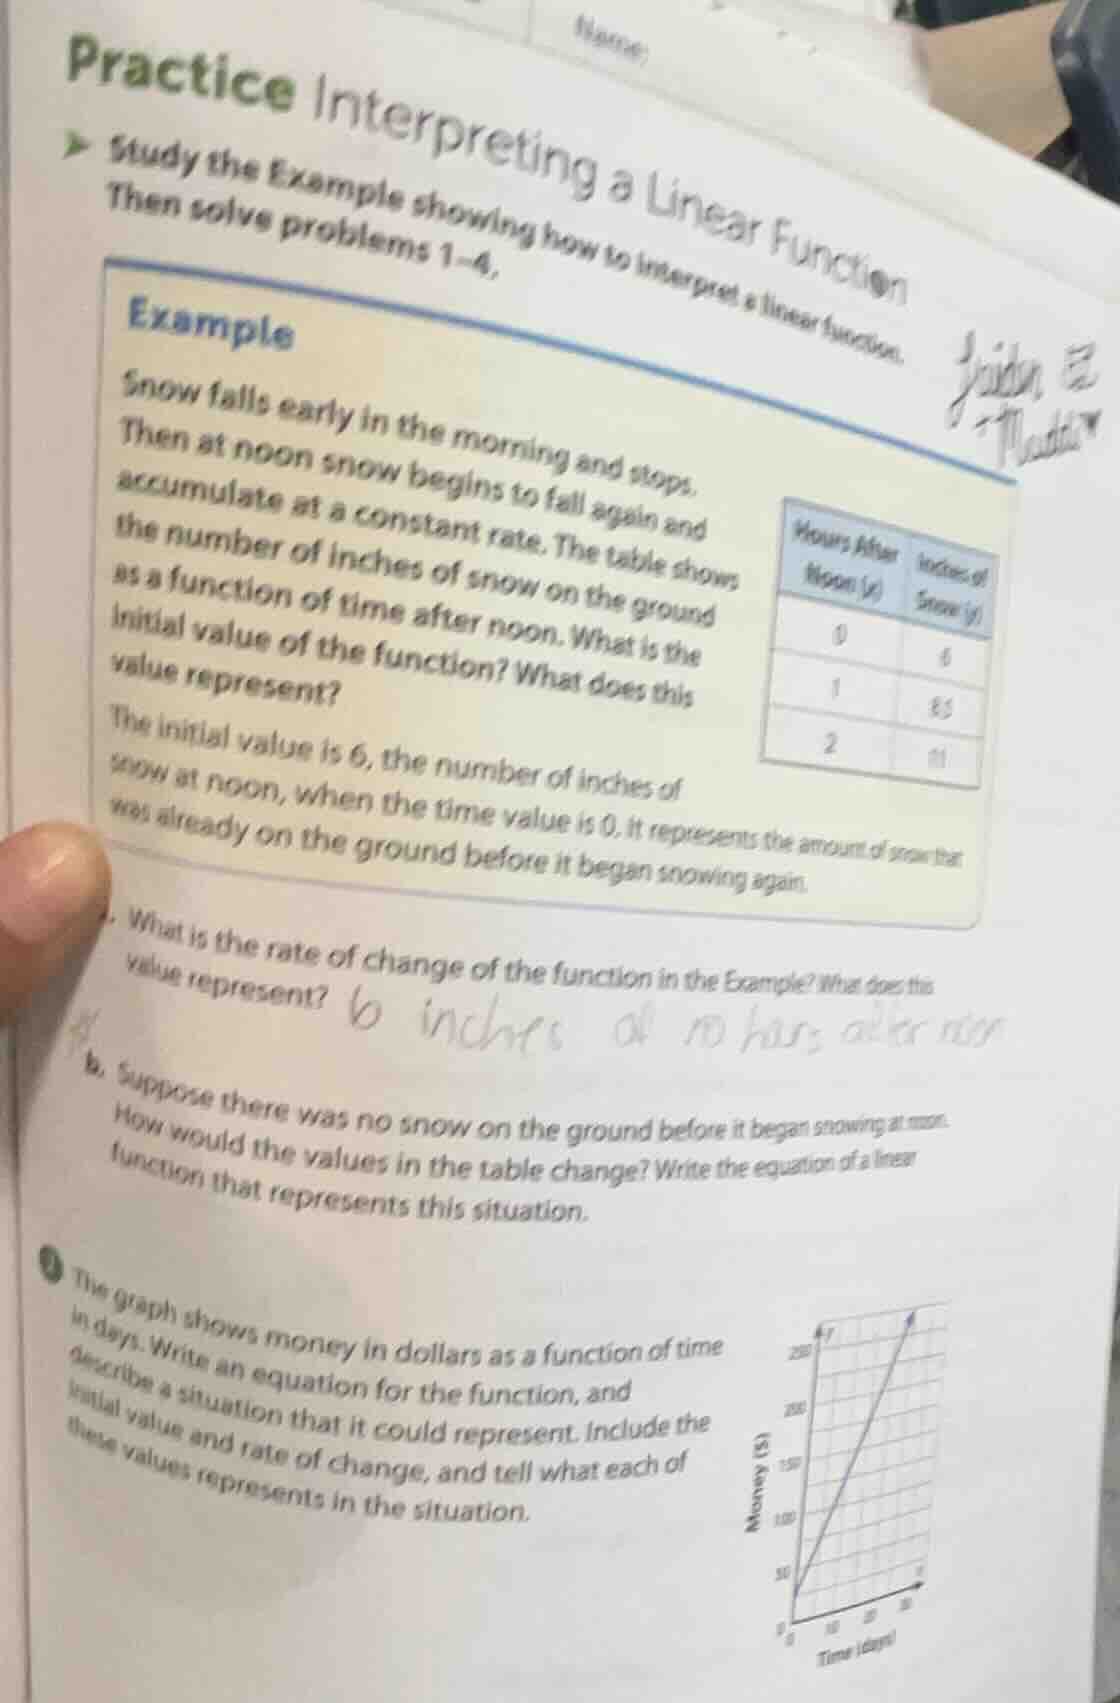
snow falls early in the morning and stops. then at noon snow begins to fall again and accumulate at a constant rate. the table shows the number of inches of snow on the ground as a function of time after noon. what is the initial value of the function? what does this value represent?
the initial value is 6, the number of inches of snow at noon, when the time value is 0. it represents the amount of snow that was already on the ground before it began snowing again.
hours after noon (x) | inches of snow (y)
0 | 6
1 | 8.5
2 | 11
what is the rate of change of the function in the example? what does this value represent?
b. suppose there was no snow on the ground before it began snowing at noon. how would the values in the table change? write the equation of a linear function that represents this situation.
the graph shows money in dollars as a function of time in days. write an equation for the function, and describe a situation that it could represent. include the initial value and rate of change, and tell what each of these values represents in the situation.
money ($)
250
200
150
100
50
0
5 10 15 20 25
time (days)
Part a: Rate of Change of the Snow Function
Step1: Recall Rate of Change Formula
The rate of change (slope) of a linear function is calculated as $\frac{\Delta y}{\Delta x}$, where $\Delta y$ is the change in the dependent variable (inches of snow) and $\Delta x$ is the change in the independent variable (hours after noon).
Step2: Select Two Points from the Table
Using the points $(0, 6)$ and $(1, 8.5)$ (or any two consecutive points).
$\Delta y = 8.5 - 6 = 2.5$
$\Delta x = 1 - 0 = 1$
Step3: Calculate Rate of Change
Rate of change $= \frac{\Delta y}{\Delta x} = \frac{2.5}{1} = 2.5$
This value represents the number of inches of snow that accumulate per hour after noon.
Step1: Determine Initial Value
If there was no snow before noon, the initial value (when $x = 0$) would be $0$.
Step2: Find New Table Values
The rate of change is still $2.5$ inches per hour (from part a).
For $x = 0$: $y = 0 + 2.5(0) = 0$
For $x = 1$: $y = 0 + 2.5(1) = 2.5$
For $x = 2$: $y = 0 + 2.5(2) = 5$
Step3: Write the Linear Function Equation
The general form of a linear function is $y = mx + b$, where $m$ is the slope (rate of change) and $b$ is the y - intercept (initial value). Here, $m = 2.5$ and $b = 0$, so the equation is $y = 2.5x$.
Step1: Identify Two Points on the Graph
From the graph, we can see that when $x = 0$ (time = 0 days), $y = 50$ (money = $50$). When $x = 10$ (time = 10 days), $y = 150$ (money = $150$).
Step2: Calculate Rate of Change (Slope)
$\Delta y = 150 - 50 = 100$
$\Delta x = 10 - 0 = 10$
Rate of change $m = \frac{\Delta y}{\Delta x} = \frac{100}{10} = 10$
Step3: Determine Initial Value (Y - Intercept)
The initial value $b$ is the value of $y$ when $x = 0$, which is $50$.
Step4: Write the Linear Function Equation
Using $y = mx + b$, we get $y = 10x + 50$
Step5: Describe the Situation
This function could represent a savings account where you start with $50$ (initial value) and deposit $10$ dollars each day (rate of change). The initial value ($50$) is the amount of money in the account at day $0$, and the rate of change ($10$) is the amount of money deposited each day.

Snap & solve any problem in the app
Get step-by-step solutions on Sovi AI
Photo-based solutions with guided steps
Explore more problems and detailed explanations
The rate of change is $2.5$ inches per hour. It represents the number of inches of snow that accumulate each hour after noon.