QUESTION IMAGE
Question
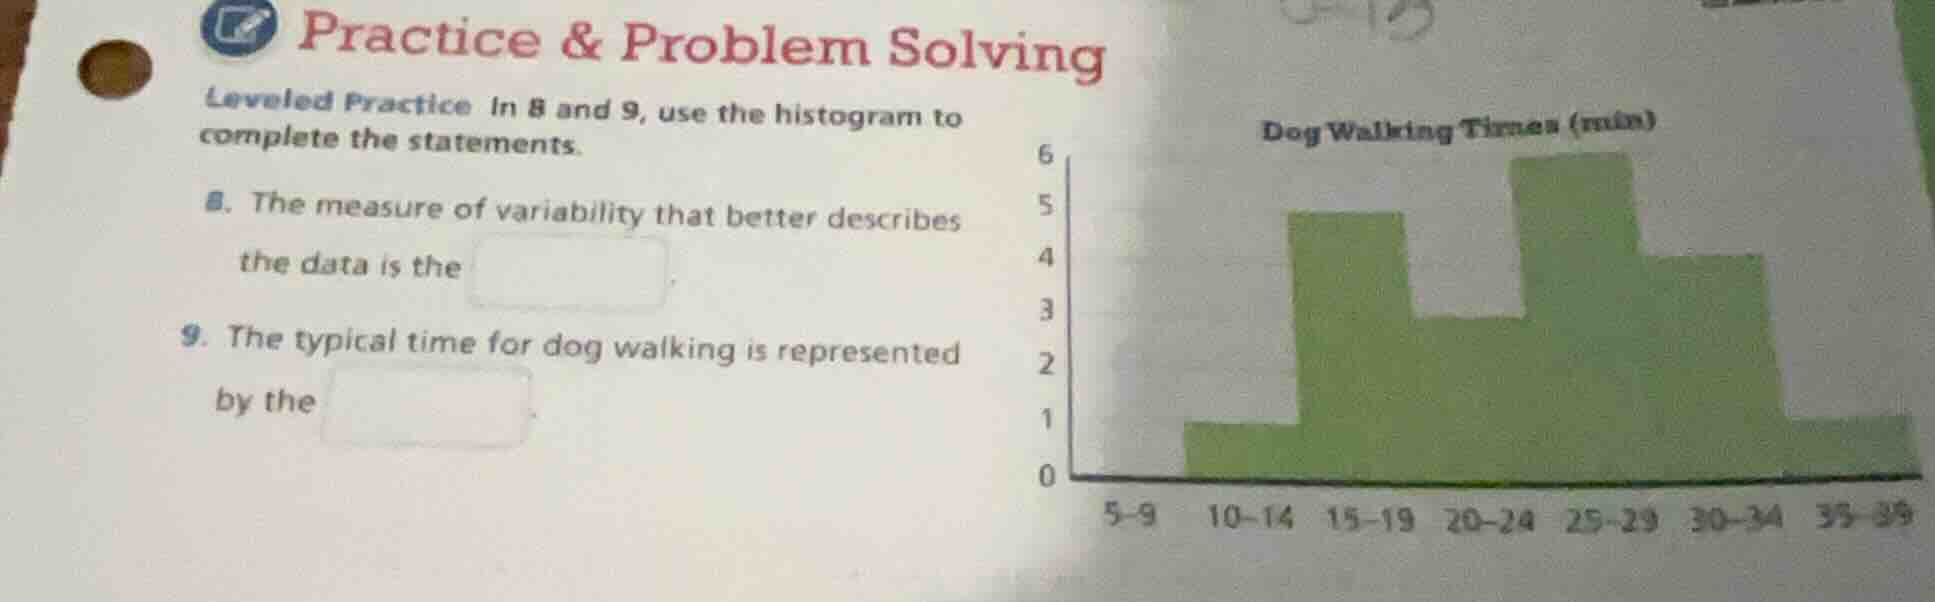
practice & problem solving leveled practice in 8 and 9, use the histogram to complete the statements. 8. the measure of variability that better describes the data is the. 9. the typical time for dog walking is represented by the. dog walking times (min) histogram with x - axis 5 - 9, 10 - 14, 15 - 19, 20 - 24, 25 - 29, 30 - 34, 35 - 39 and y - axis 0 - 6
For question 8: The histogram is skewed (not symmetric), so the interquartile range (IQR) is a better measure of variability than the range or standard deviation, as it is less affected by skewness and outliers.
For question 9: Since the data is skewed, the median (the middle value of the dataset) is a better representation of the typical value than the mean, as the mean would be pulled by the skewed tail.

Snap & solve any problem in the app
Get step-by-step solutions on Sovi AI
Photo-based solutions with guided steps
Explore more problems and detailed explanations
- interquartile range (IQR)
- median