QUESTION IMAGE
Question
practice problems; lesson 3
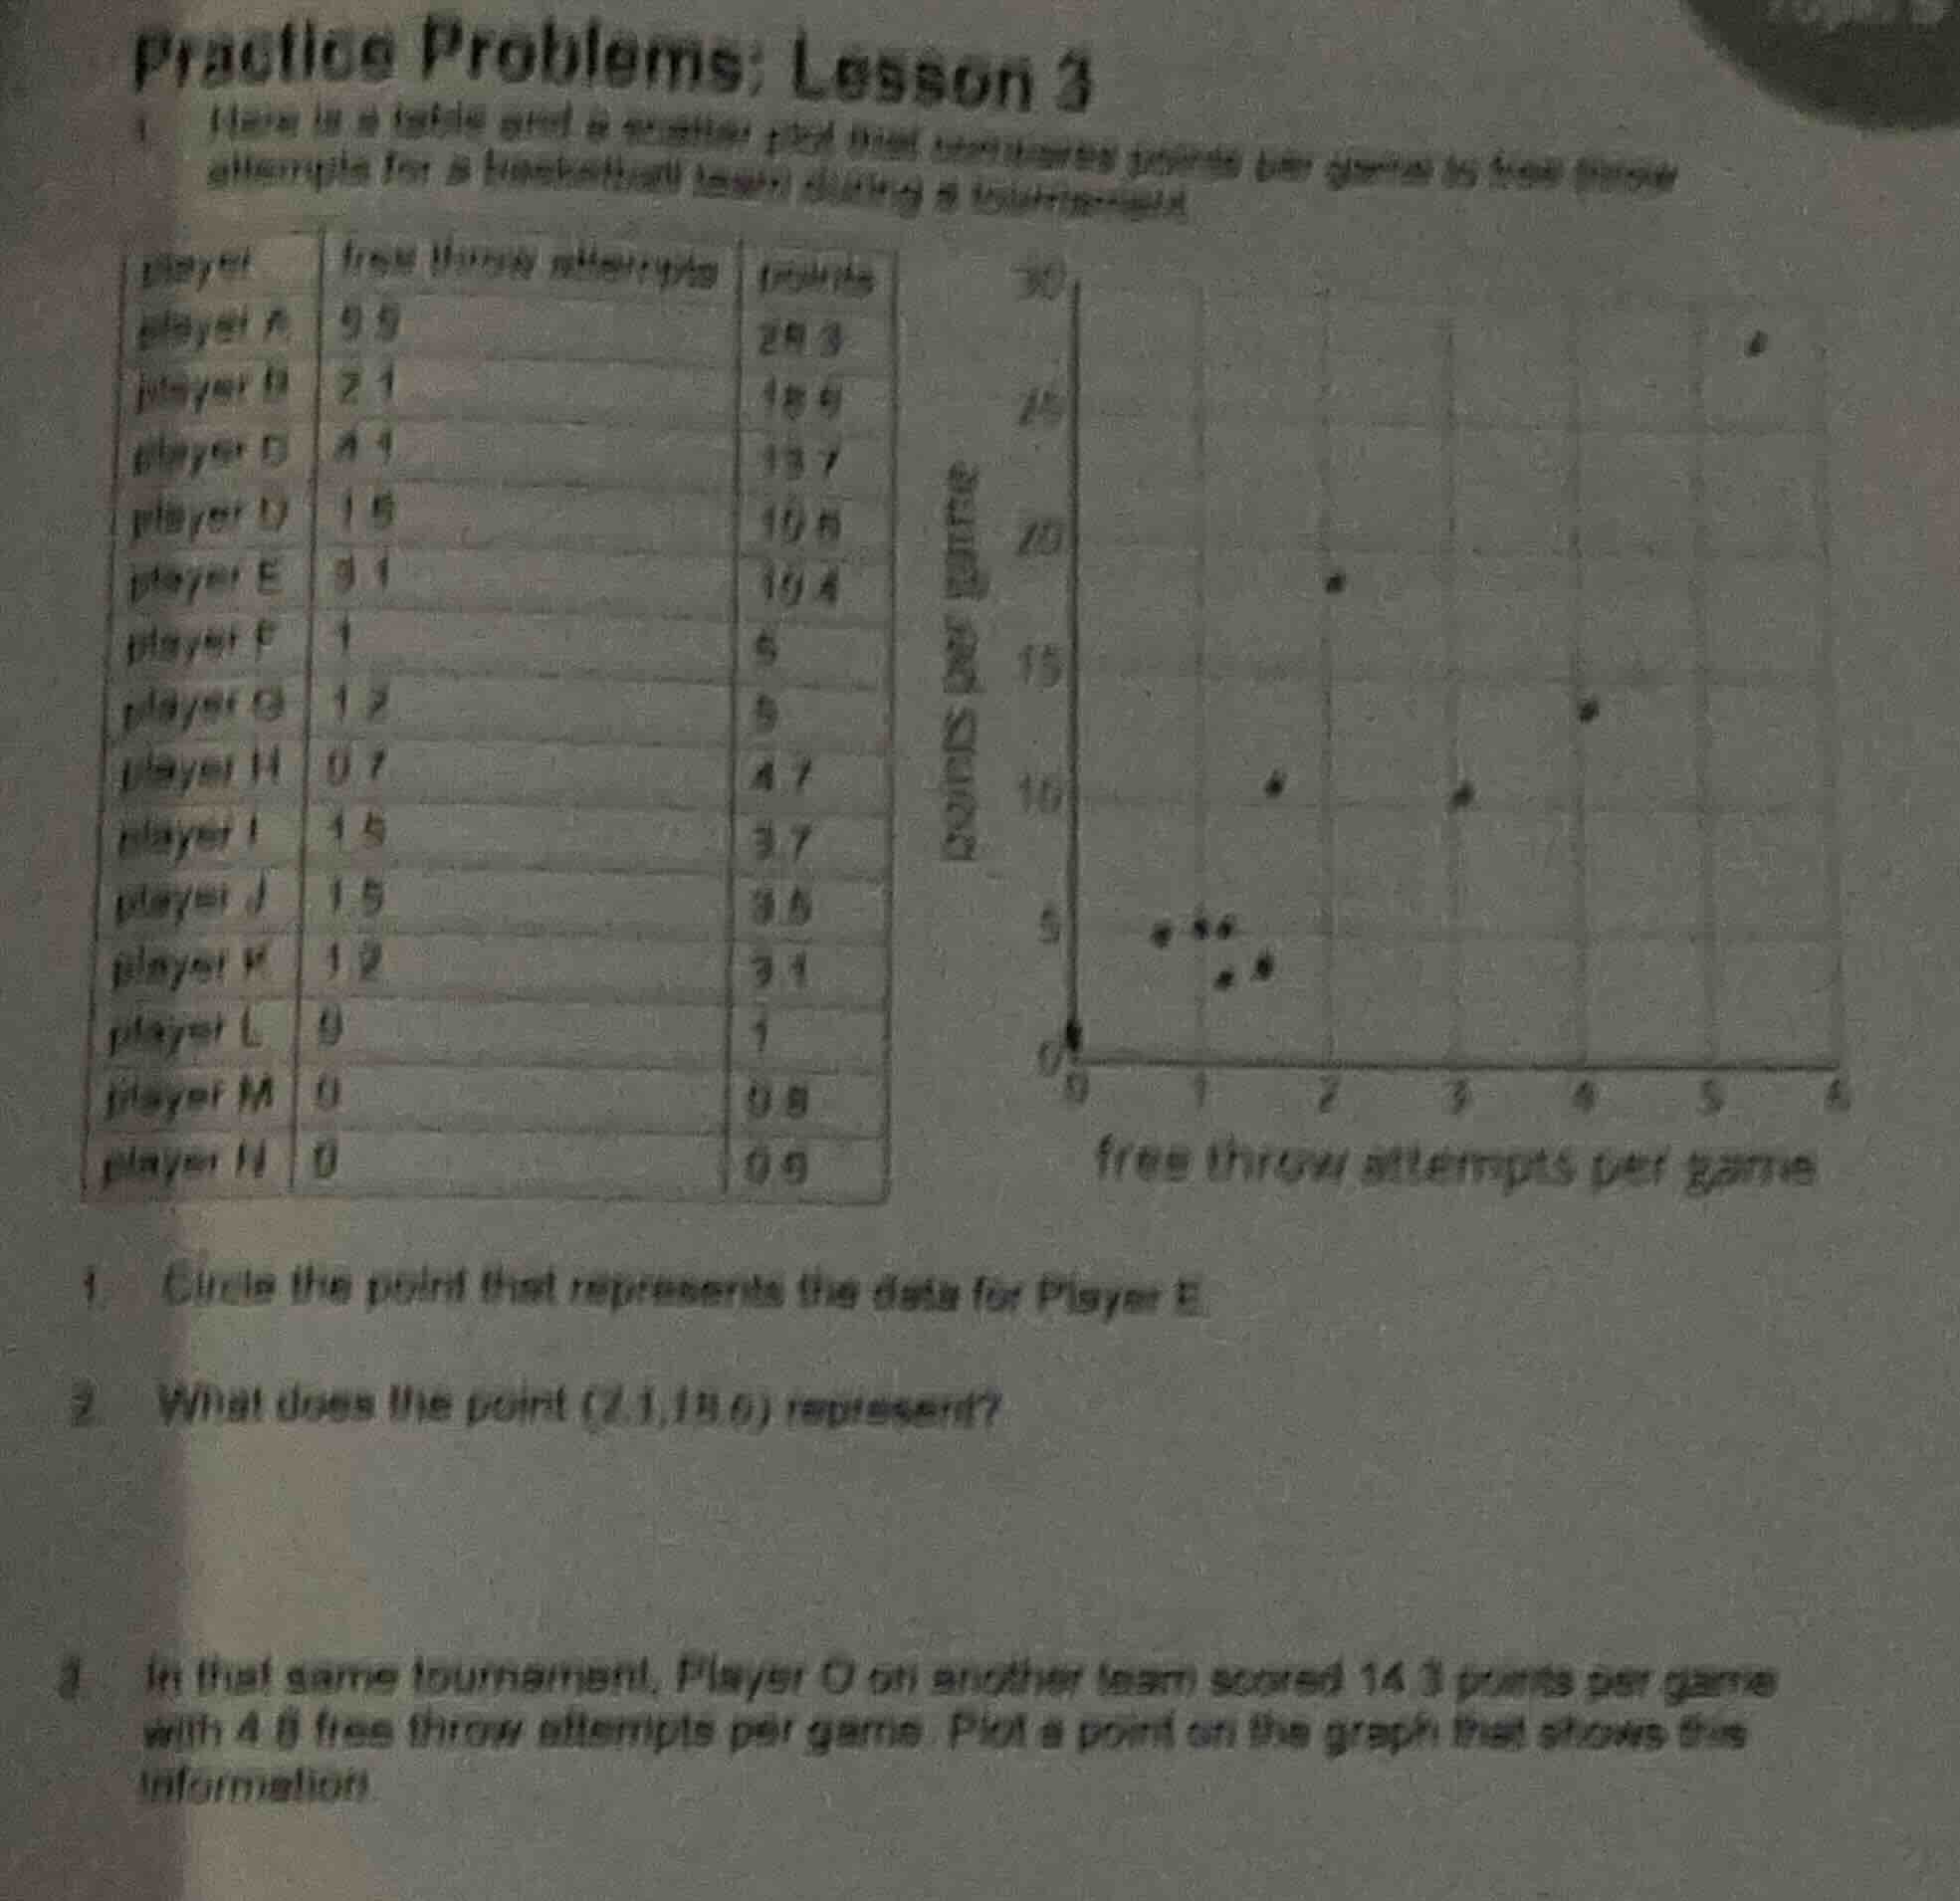
here is a table and a scatter plot that show data for a basketball team during a tournament.
- circle the point that represents the data for player e.
- what does the point (2.1, 18.6) represent?
- in that same tournament, player o on another team scored 14.3 points per game with 4.0 free throw attempts per game. plot a point on the graph that shows this information.
Brief Explanations
- Locate Player E in the table: they have 3.1 free throw attempts per game (x-axis) and 10.4 points per game (y-axis). Find the corresponding point on the scatter plot and circle it.
- Match the coordinates to the table columns: the first value is free throw attempts per game, the second is points per game. This pair matches Player B's data.
- On the scatter plot, find 4.8 on the x-axis (free throw attempts) and 14.3 on the y-axis (points per game), then plot a point at their intersection.

Snap & solve any problem in the app
Get step-by-step solutions on Sovi AI
Photo-based solutions with guided steps
Explore more problems and detailed explanations
- Circle the point at (3.1, 10.4) on the scatter plot.
- The point (2.1, 18.6) represents Player B, who had 2.1 free throw attempts per game and scored 18.6 points per game during the tournament.
- Plot a point at the intersection of x=4.8 (free throw attempts per game) and y=14.3 (points per game) on the scatter plot.