QUESTION IMAGE
Question
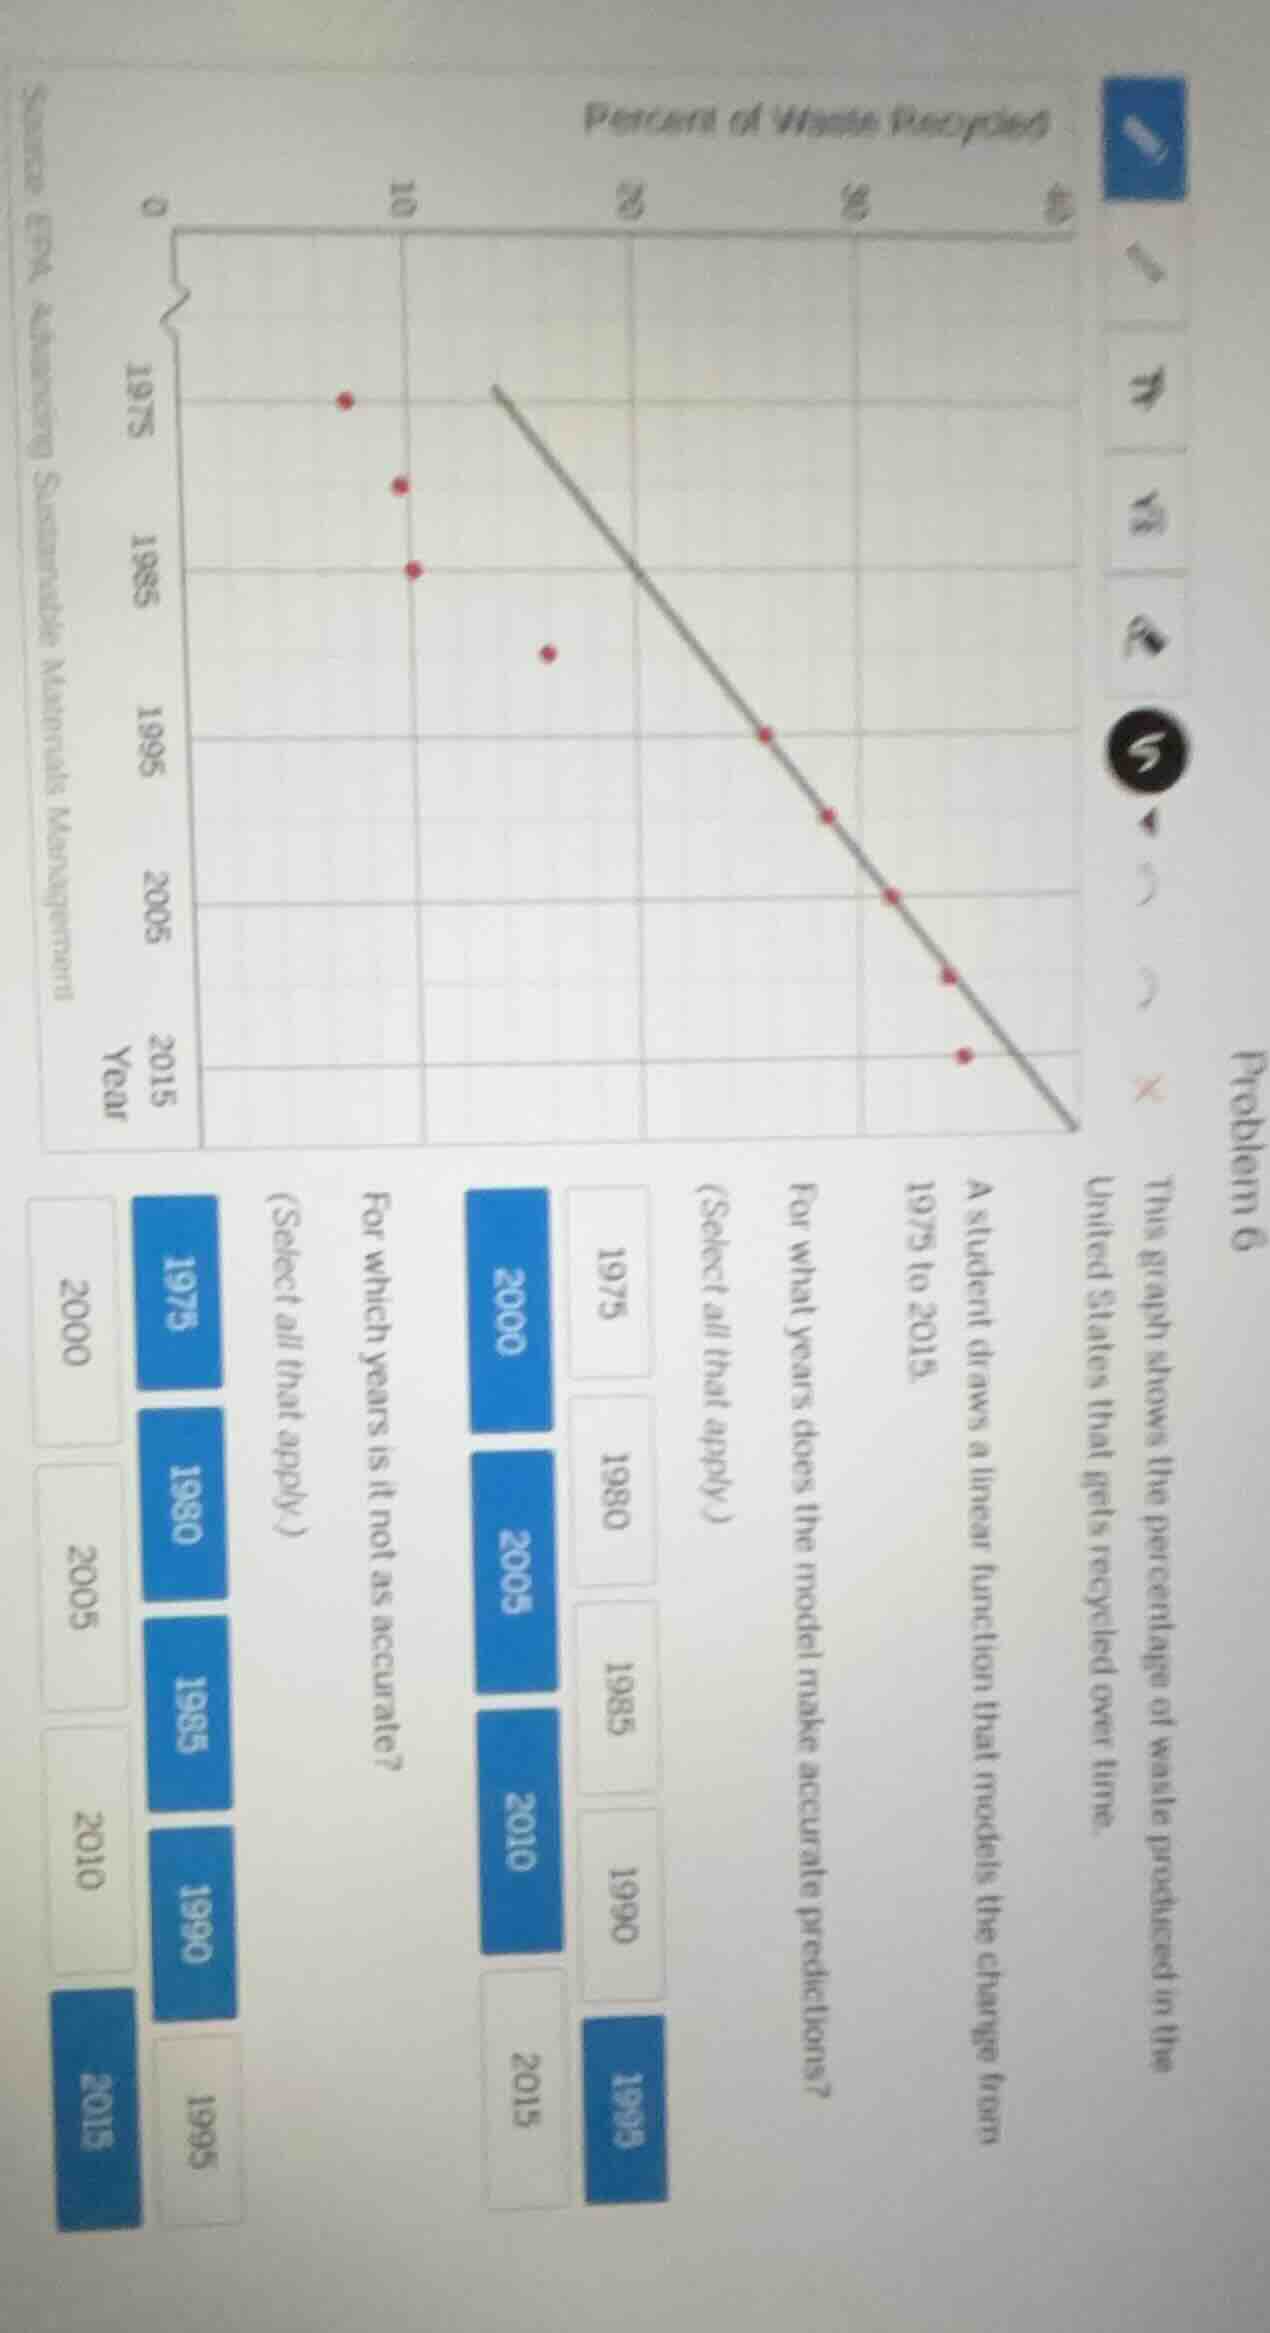
problem 6
this graph shows the percentage of waste produced in the united states that gets recycled over time.
a student draws a linear function that models the change from 1975 to 2015.
for what years does the model make accurate predictions?
(select all that apply)
1975 1980 1985 1990 1995
2000 2005 2010 2015
for which years is it (not as accurate)?
(select all that apply)
1975 1980 1985 1990 1995
2000 2005 2010 2015
Part 1: Years with Accurate Predictions
To determine when the linear model is accurate, we check which data points lie close to the linear trend line. From the graph, the points for 2000, 2005, 2010, and 2015 (and 1995, as the line passes near it) align well with the linear model. Wait, re - evaluating: the blue - highlighted (selected) years for accurate are 2000, 2005, 2010, 1995? Wait, no, looking at the options: the first set (accurate) has 2000, 2005, 2010, 1995? Wait, the graph's linear line: the points on or near the line are around 1995, 2000, 2005, 2010, 2015? Wait, the given options for the first question (accurate) are 1975, 1980, 1985, 1990, 1995 (with 1995 selected), and 2000, 2005, 2010, 2015 (with 2000, 2005, 2010, 2015? Wait, the blue boxes: for the first part (accurate), the selected (blue) are 2000, 2005, 2010, 1995? Wait, no, the user's image shows: for the first question (For what years does the model make accurate predictions?), the options are 1975, 1980, 1985, 1990, 1995 (1995 is blue), and 2000, 2005, 2010, 2015 (2000, 2005, 2010, 2015 are blue? Wait, no, the blue boxes: 1995, 2000, 2005, 2010, 2015? Wait, the linear model is drawn from around 1990 - 2015? Wait, the data points before 1995 (1975, 1980, 1985) are below the line, and from 1995 onwards, the points are on or near the line. So the accurate years are 1995, 2000, 2005, 2010, 2015.
Part 2: Years with Inaccurate Predictions
For the second question (For which years is it not as accurate?), the points are far from the line. The years 1975, 1980, 1985, 1990 (since their data points are below the linear model) are not accurate. The blue boxes here are 1975, 1980, 1985, 1990.
Final Answers
Part 1: Accurate Years
The years where the linear model makes accurate predictions are those whose data points lie on or close to the linear trend line. From the graph and options, these are 1995, 2000, 2005, 2010, 2015 (but looking at the given options in the image, the selected (blue) for accurate are 1995, 2000, 2005, 2010, 2015? Wait, the image shows: for the first question, the options are 1975 (unselected), 1980 (unselected), 1985 (unselected), 1990 (unselected), 1995 (selected), 2000 (selected), 2005 (selected), 2010 (selected), 2015 (selected).
Part 2: Inaccurate Years
The years where the model is not accurate are those with data points far from the line, i.e., 1975, 1980, 1985, 1990 (selected in blue in the image for the second question).

Snap & solve any problem in the app
Get step-by-step solutions on Sovi AI
Photo-based solutions with guided steps
Explore more problems and detailed explanations
(Accurate Years)
1995, 2000, 2005, 2010, 2015