QUESTION IMAGE
Question
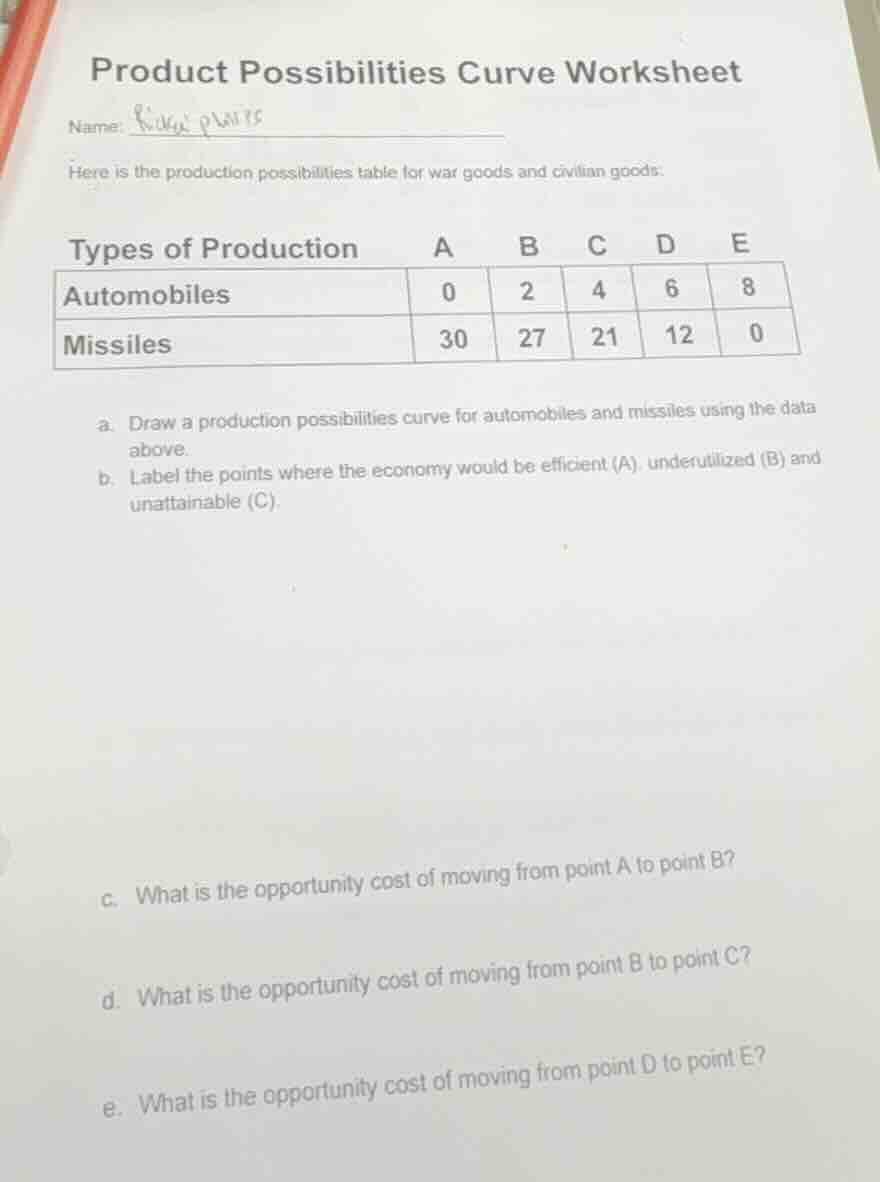
product possibilities curve worksheet
name: ricky plaries
here is the production possibilities table for war goods and civilian goods:
types of production a b c d e
automobiles 0 2 4 6 8
missiles 30 27 21 12 0
a. draw a production possibilities curve for automobiles and missiles using the data above.
b. label the points where the economy would be efficient (a), underutilized (b) and unattainable (c).
c. what is the opportunity cost of moving from point a to point b?
d. what is the opportunity cost of moving from point b to point c?
e. what is the opportunity cost of moving from point d to point e?
Part c: Opportunity Cost from A to B
Step1: Identify production at A and B
At point A: Automobiles = 0, Missiles = 30
At point B: Automobiles = 2, Missiles = 27
Step2: Calculate change in production
Change in Automobiles: \( 2 - 0 = 2 \) (increase)
Change in Missiles: \( 27 - 30 = -3 \) (decrease, so 3 missiles forgone)
Step3: Determine opportunity cost
Opportunity cost of 2 automobiles is 3 missiles.
Opportunity cost of 1 automobile: \( \frac{3}{2} = 1.5 \) missiles.
Part d: Opportunity Cost from B to C
Step1: Identify production at B and C
At point B: Automobiles = 2, Missiles = 27
At point C: Automobiles = 4, Missiles = 21
Step2: Calculate change in production
Change in Automobiles: \( 4 - 2 = 2 \) (increase)
Change in Missiles: \( 21 - 27 = -6 \) (decrease, so 6 missiles forgone)
Step3: Determine opportunity cost
Opportunity cost of 2 automobiles is 6 missiles.
Opportunity cost of 1 automobile: \( \frac{6}{2} = 3 \) missiles.
Part e: Opportunity Cost from D to E
Step1: Identify production at D and E
At point D: Automobiles = 6, Missiles = 12
At point E: Automobiles = 8, Missiles = 0
Step2: Calculate change in production
Change in Automobiles: \( 8 - 6 = 2 \) (increase)
Change in Missiles: \( 0 - 12 = -12 \) (decrease, so 12 missiles forgone)
Step3: Determine opportunity cost
Opportunity cost of 2 automobiles is 12 missiles.
Opportunity cost of 1 automobile: \( \frac{12}{2} = 6 \) missiles.

Snap & solve any problem in the app
Get step-by-step solutions on Sovi AI
Photo-based solutions with guided steps
Explore more problems and detailed explanations
s:
c. Opportunity cost of moving from A to B: 3 missiles (or 1.5 missiles per automobile).
d. Opportunity cost of moving from B to C: 6 missiles (or 3 missiles per automobile).
e. Opportunity cost of moving from D to E: 12 missiles (or 6 missiles per automobile).
(Note: For part a, to draw the PPC:
- Plot the points (0,30), (2,27), (4,21), (6,12), (8,0) on a graph with Automobiles on the x - axis and Missiles on the y - axis.
- Connect these points with a smooth curve (or straight - line segments between consecutive points).
For part b:
- Efficient points: All the points on the PPC (A, B, C, D, E as per the table since they are on the curve).
- Underutilized points: Points inside the PPC (e.g., any point with fewer automobiles and missiles than the PPC points, like (1,28) which is inside).
- Unattainable points: Points outside the PPC (e.g., (3,30) as 3 automobiles and 30 missiles is beyond the curve).)