QUESTION IMAGE
Question
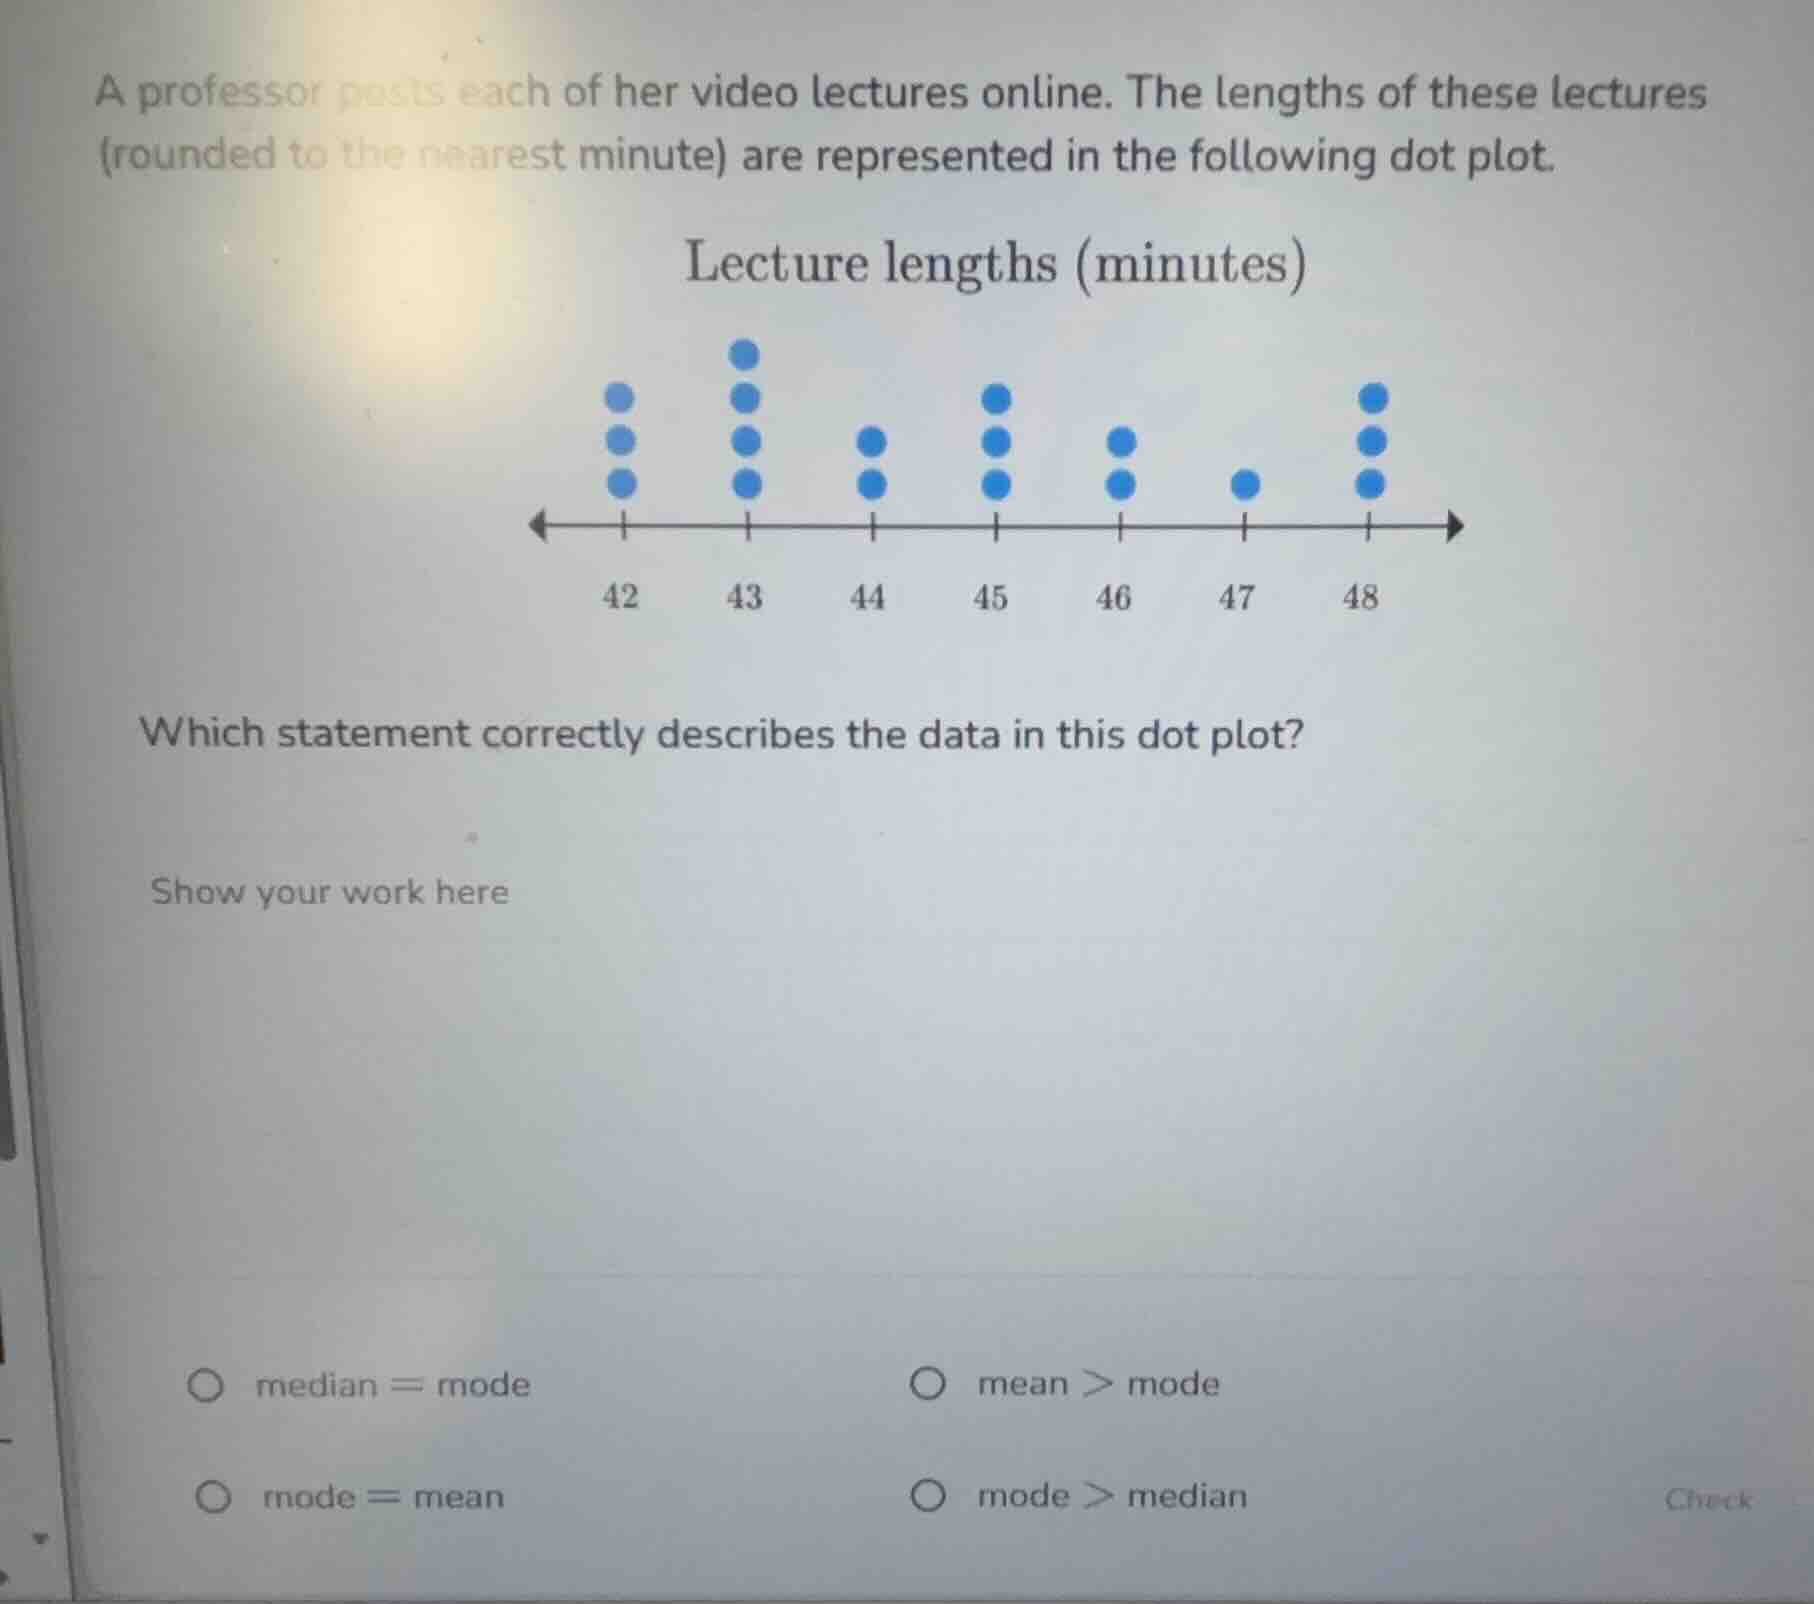
a professor posts each of her video lectures online. the lengths of these lectures (rounded to the nearest minute) are represented in the following dot plot.\
lecture lengths (minutes)\
which statement correctly describes the data in this dot plot?\
show your work here\
\
\bigcirc median = mode \qquad \bigcirc mean > mode\
\bigcirc mode = mean \qquad \bigcirc mode > median
Step1: List all data points
$42, 42, 42, 43, 43, 43, 43, 44, 44, 45, 45, 45, 46, 46, 47, 48, 48, 48$
Step2: Find the mode
Mode = most frequent value = $43$
Step3: Find the median
Total data points: $n=18$. Median = average of 9th and 10th values: $\frac{44+45}{2}=44.5$
Step4: Calculate the mean
Mean = $\frac{3(42)+4(43)+2(44)+3(45)+2(46)+1(47)+3(48)}{18}$
$=\frac{126+172+88+135+92+47+144}{18}=\frac{804}{18}\approx44.67$
Step5: Compare values
Mean ($\approx44.67$) > Mode ($43$)

Snap & solve any problem in the app
Get step-by-step solutions on Sovi AI
Photo-based solutions with guided steps
Explore more problems and detailed explanations
mean > mode