QUESTION IMAGE
Question
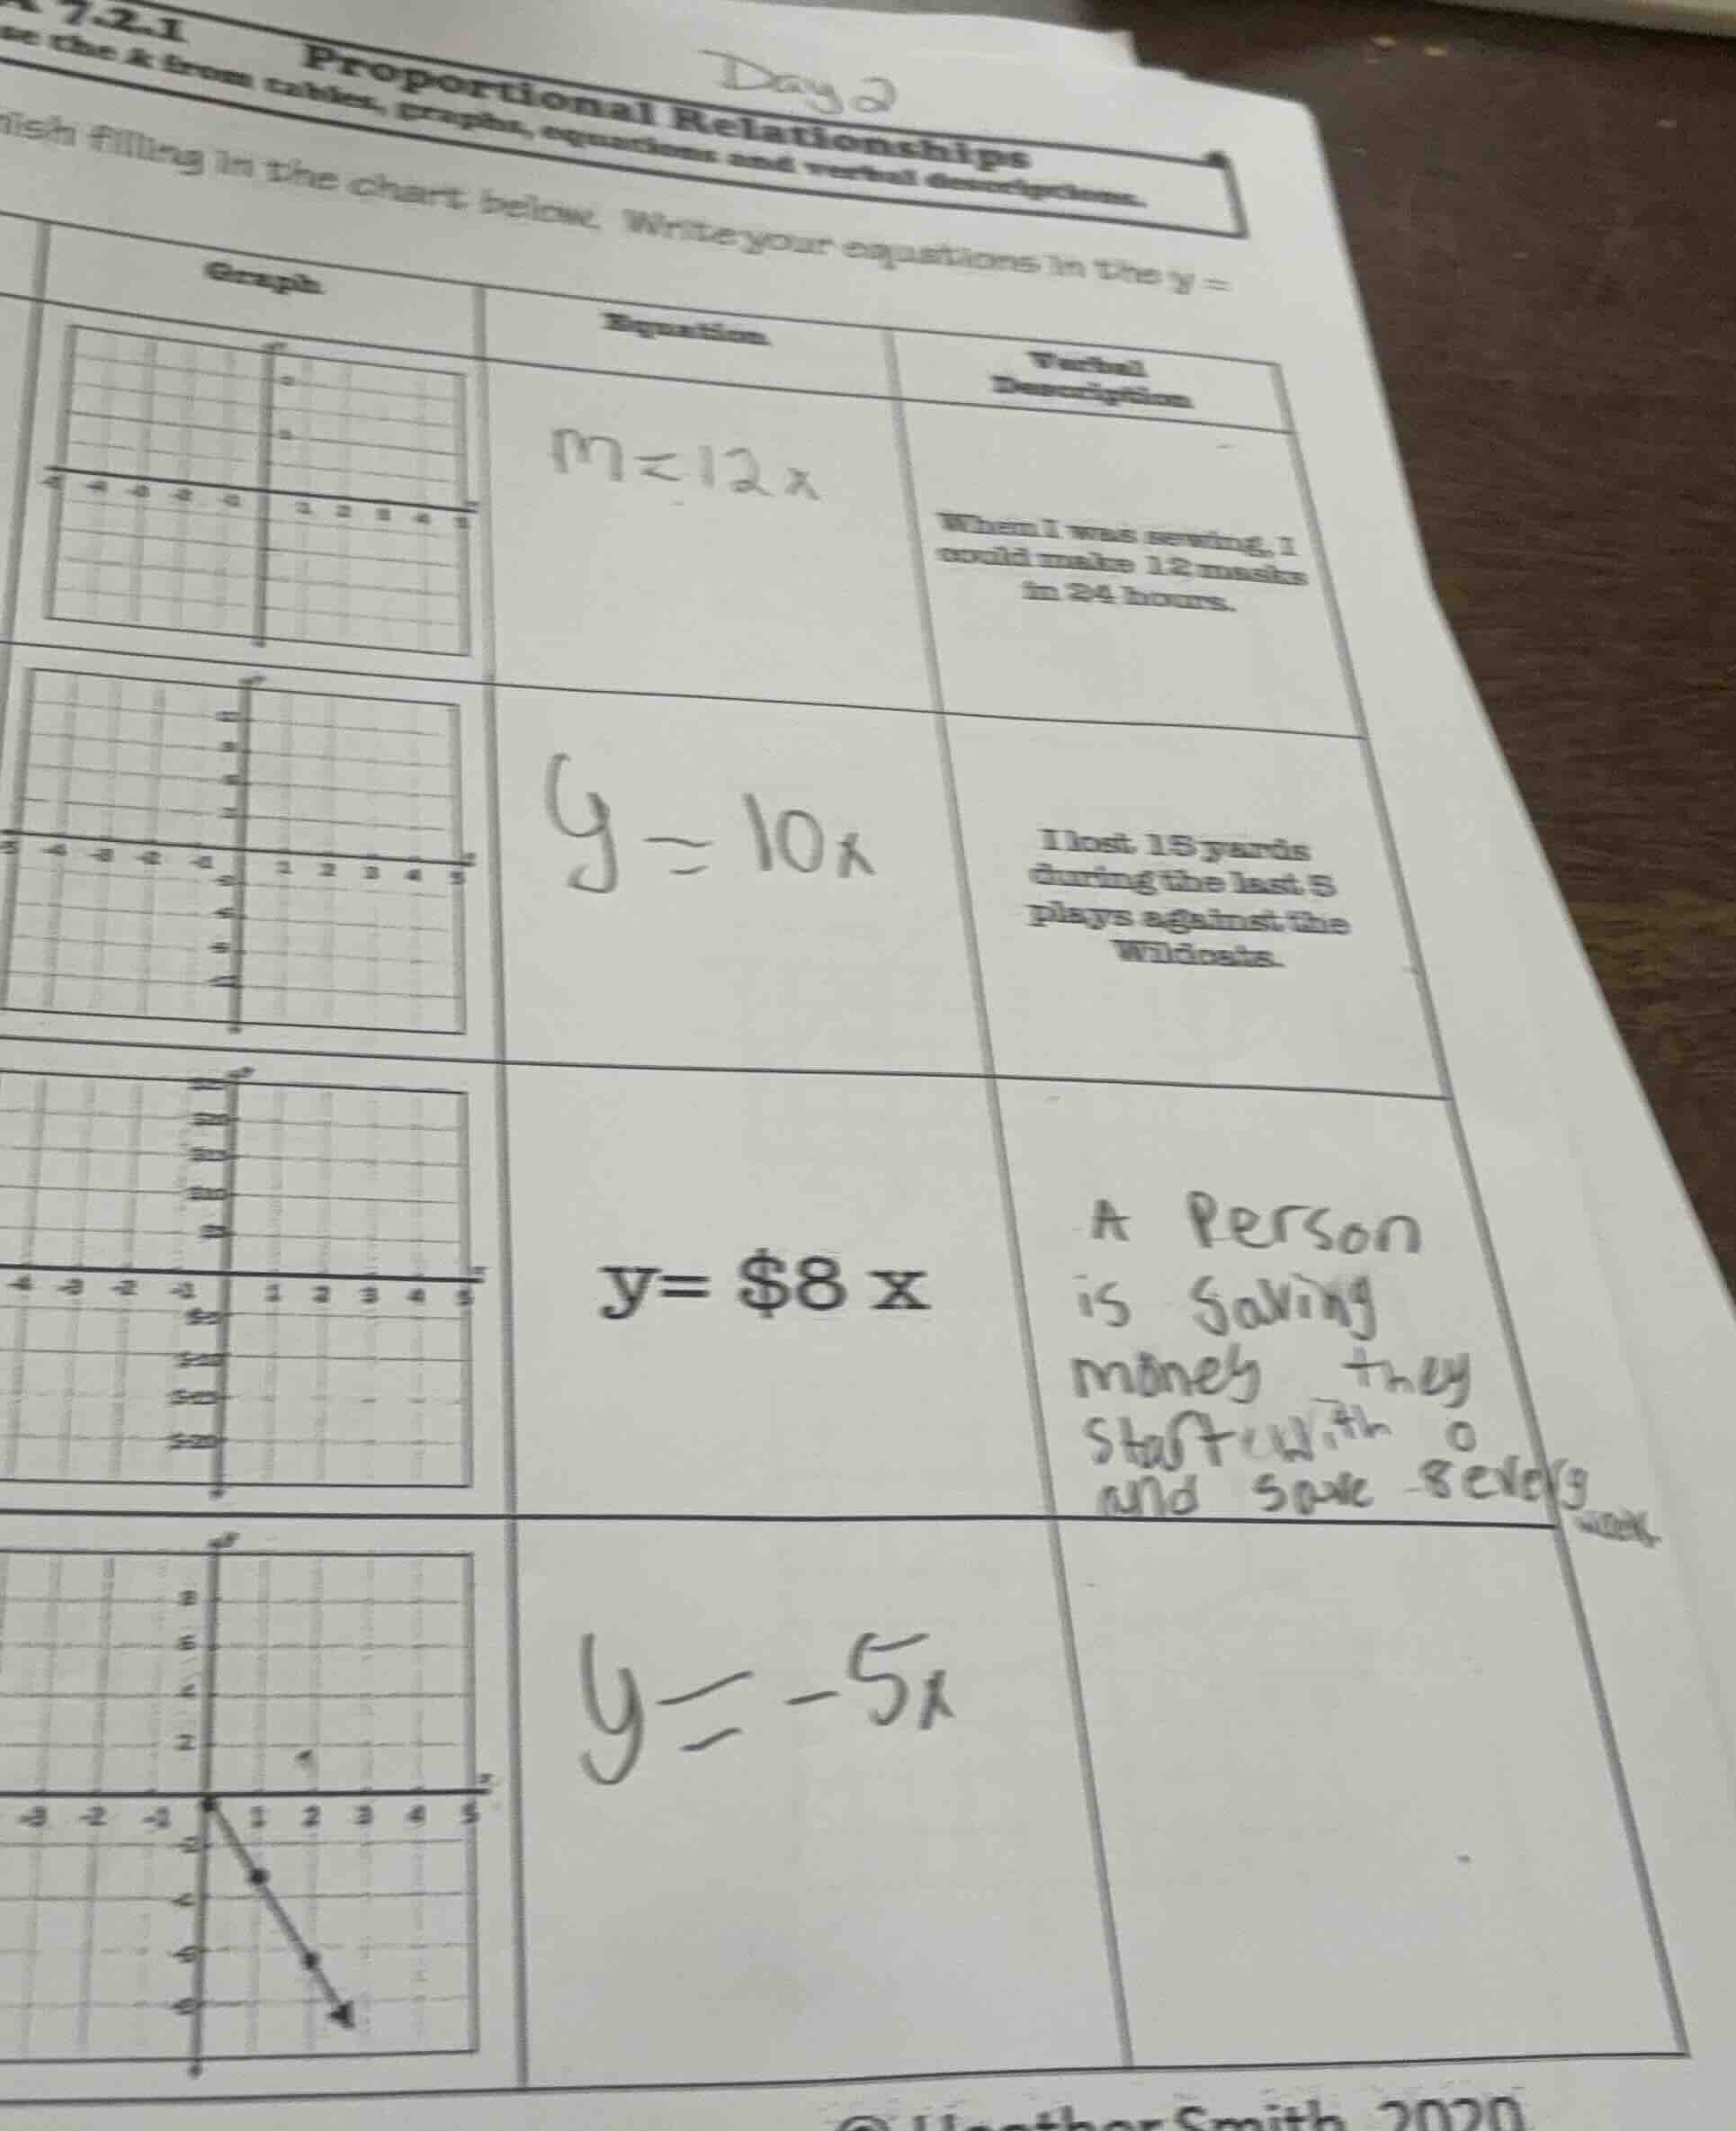
7.2.1 proportional relationships
ish filling in the chart below. write your equations in the y =
graph \t equation \t verbal description
graph \t m = 12x \t when i was sewing, i could make 12 masks in 24 hours.
graph \t y = 10x \t i lost 15 yards during the last 5 plays against the wildcats.
graph \t y = $8 x \t a person is saving money they start with 0 and save $8 every week.
graph \t y = -5x \t
© heather smith 2020
Step1: Correct 1st proportional equation
First, find the rate: $\frac{12}{24} = 0.5$. So the equation is $m = 0.5x$.
Step2: Correct 2nd proportional equation
Calculate the rate: $\frac{-15}{5} = -3$. So the equation is $y = -3x$.
Step3: Write 3rd verbal description clearly
The description is: A person starts with $0 and saves $8 each week.
Step4: Write 4th verbal description
The graph/equation shows a rate of -5, so: Over x plays, a team loses 5 yards per play, for a total loss of y yards.
Step5: Note graph plotting rule
For each equation, plot points like $(0,0)$, $(1, k)$ where $k$ is the coefficient, then draw a straight line through them.

Snap & solve any problem in the app
Get step-by-step solutions on Sovi AI
Photo-based solutions with guided steps
Explore more problems and detailed explanations
- First row (Graph/Equation fix):
- Equation: $m = 0.5x$
- Graph: Plot points $(0,0)$, $(2,1)$, $(4,2)$ and draw a line through them.
- Second row (Equation fix):
- Equation: $y = -3x$
- Graph: Plot points $(0,0)$, $(1,-3)$, $(2,-6)$ and draw a line through them.
- Third row (Verbal Description clarity):
- Verbal Description: A person starts with $0 and saves $8 each week.
- Graph: Plot points $(0,0)$, $(1,8)$, $(2,16)$ and draw a line through them.
- Fourth row (Verbal Description):
- Verbal Description: A team loses 5 yards per football play; y is the total yards lost after x plays.